python pd Series 添加行_逻辑回归多分类的Python实现
众所周知,逻辑回归是一种主要用来做二分类的算法,但是,逻辑回归其实也可以用来做多分类!
今天记录和分享一个逻辑回归做多分类的例子,以备查阅。
本文用到的数据集已经上传至云盘,需要练手的小伙伴自提~
链接:https://pan.baidu.com/s/1sFbCQEsj5G81qa4TtzUL6A
提取码:8tiw
数据集基本情况如下:共4个特征变量(gre(考试成绩),gpa(平均成绩点),gender(性别),prestige(学校威望)),1个分类变量admit(是否录取)。其中admit有3种取值:1表示录取,0表示待考虑,-1表示不录取。A列为索引列。prestige(学校威望)取值共1、2、3、4,4种情况,值越大,表示学校声望越差。
1.读入数据
import pandas as pd
pd.set_option('display.max_columns', 500)#设置最大显示宽度为500
filename = 'D:graduate3type.csv'
data = pd.read_csv(filename, index_col=0)#index_col=0表示数据的第0列是索引列
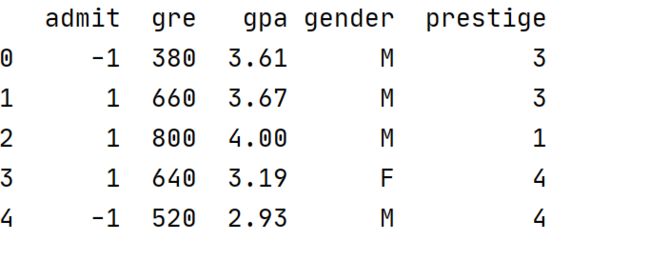
print(data.head())
2.查看数据基本情况
(1)查看数据结构
data.shape
#结果:(400, 5)#表示有400行,5列
(2)查看各字段是否有缺失值
data.isnull().sum(axis=0)
#结果:
admit       0
gre         0
gpa         0
gender      0
prestige    0
dtype: int64
#表明各字段均没有缺失值
(3)如果有缺失值,可以删除缺失值所在的行
data.dropna(inplace=True,how='any') 注:inplace = True表示不创建新的对象,直接对原始对象进行修改。how = 'any'表示只要一行中有一个缺失值,就删除整行记录。how = 'all'表示只有当整行均为缺失值才删除该行。
(4)查看数据的基础统计指标
print (data.describe()) #这里只会返回数值型变量的统计指标,对于性别这种字符型变量无法进行统计(5)查看prestige(学校威望)与admit(是否录取)的频数关系
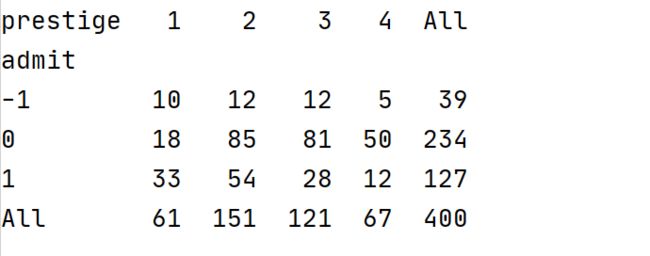
t = pd.crosstab(index=data['admit'], columns=data['prestige'],margins=True)
print(t)
如果想知道同一个录取状态下,各个学校声望的分布如何,可以设置normalize='index':
t = pd.crosstab(index=data['admit'], columns=data['prestige'],margins=True,normalize='index')
print(t)
每行求和结果为1。
如果想知道同一学校声望下,录取状态如何分布的,可以设置normalize='columns'
t = pd.crosstab(index=data['admit'], columns=data['prestige'],margins=True,normalize='columns')
print(t)
此时,各列的求和为1。
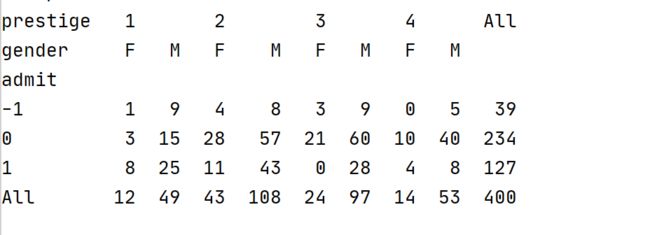
另外,crosstab()函数支持多个列字段,或多个行字段。如:查看同一学校声望下,不同性别的录取情况。
d = pd.crosstab(index=data['admit'], columns=[data['prestige'],data['gender']],margins=True)
print(d)
注:pandas库中的crosstab()函数主要用来创建类似于透视表的数据表,基本语法如下:
crosstab(index, columns, values=None, rownames=None, colnames=None, aggfunc=None, margins=False, margins_name: str = 'All', dropna: bool = True, normalize=False) -> 'DataFrame'
    Compute a simple cross tabulation of two (or more) factors. By default
    computes a frequency table of the factors unless an array of values and an
    aggregation function are passed.

    Parameters
    ----------
    index : array-like, Series, or list of arrays/Series
        Values to group by in the rows.#指明按哪个字段的取值作为行
    columns : array-like, Series, or list of arrays/Series
        Values to group by in the columns.#指明按哪个字段的取值作为列
    rownames : sequence, default None
        If passed, must match number of row arrays passed.
    colnames : sequence, default None
    margins : bool, default False#用于增加一个汇总行和汇总列
        Add row/column margins (subtotals).
    normalize : bool, {'all', 'index', 'columns'}, or {0,1}, default False
        Normalize by dividing all values by the sum of values.#用于按行(index)或者按列(colunms)计算百分比
(6)绘制录取情况的频数分布图
#计数不同录取状态的频数,为后续添加数值标签做准备
a = data['admit'].value_counts()
b = pd.DataFrame({'admit_type':pd.Series(a.index),
                 'counts':pd.Series(a.values)})
b = b.sort_values(by='admit_type',ascending=True)#这里排序后prestige_type为1~4,目的是为了和下面countplot()函数生成的柱状图顺序保持一致,然后就可以按相同顺序给柱状图添加数值标签
print(b)

#绘制admit的频数分布图
import matplotlib.pyplot as plt
import seaborn as sns
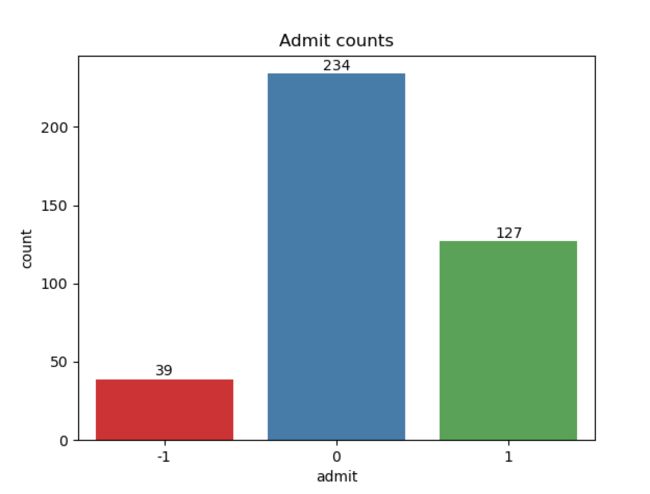
ax = sns.countplot(x='admit',data=data,palette='Set1')#palette其他可选参数为:Set2、Set3
plt.title('Admit counts')
for x,y in zip(b.admit_type,b.counts):
    plt.text(x+1,y+5,str(y),horizontalalignment='center',verticalalignment='center')
#plt.text(x,y,s,horizontalalignment,verticalalignment),其中x,y为点的坐标值,可以根据绘图数字进行一定的加减调出比较合适的坐标。s为数据标签的内容。horizontalalignment和verticalalignment用于设置标签的水平方位和垂直方位。
#这里x+1是因为admit的取值是从-1到1,而绘图系统的取值是从0开始。
通过这个图形,我了解到原来python在绘图方面还支持多个库的并用和兼容,即多个库可以同时对一张画布进行参数设置。这里,我们使用了seaborn和matplotlib两个库进行参数设置,没有报错~
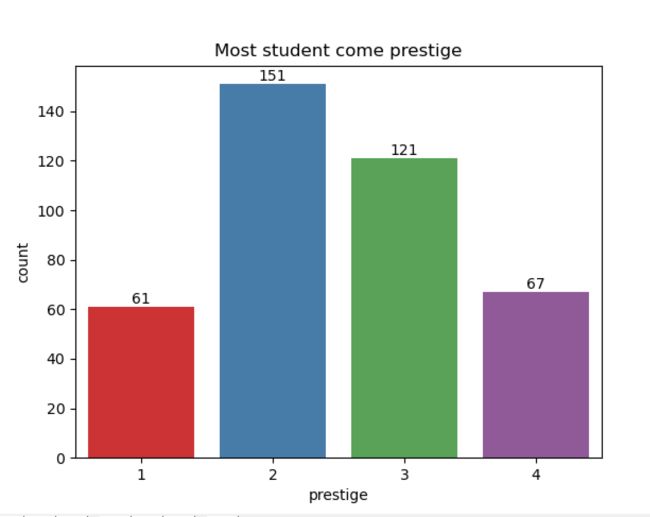
(7)绘制学校声望的频数分布图
#计算不同等级学校的频数分布
a = data['prestige'].value_counts()
b = pd.DataFrame({'prestige_type':pd.Series(a.index),
                 'counts':pd.Series(a.values)})
b = b.sort_values(by='prestige_type',ascending=True)
##绘制不同等级学校的频数分布图
import matplotlib.pyplot as plt
import seaborn as sns
ax = sns.countplot(x='prestige',data=data,palette='Set1')
plt.title('Most student come prestige')
for x,y in zip(b.prestige_type,b.counts):
    plt.text(x-1,y+3,str(y),horizontalalignment='center',verticalalignment='center')

#这里x-1是因为,我的x数据(prestige_type)从1开始的,但是在绘图系统中,是从0开始的。
(8)绘制gre数值分布
import matplotlib.pyplot as plt
import seaborn as sns
sns.set(style="white")#置绘图风格,white为白底,其他可选参数有darkgrid/whitegrid
ax=data['gre'].hist(bins=15,color='teal',alpha=0.6)#alpha用于设置柱体颜色的透明度,取值范围为0~1,值越大,颜色越深
ax.set(xlabel='gre')
ax.set(ylabel='number')
ax.set(title='gre_number hist')
 plt.xlim(100,1000)  #限定x轴的取值范围
(9)绘制所有连续型变量的箱线图,查看数据分布状态
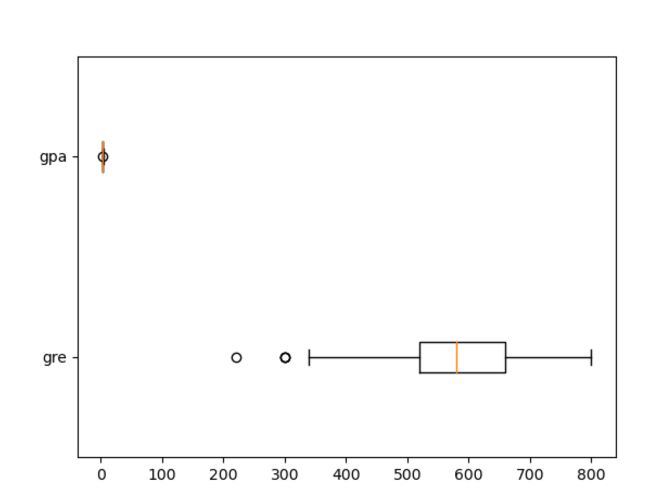
尝试将两个(多个)箱线图绘制在一张图上:
import matplotlib.pyplot as plt
plt.boxplot(x = (data['gre'],data['gpa']),labels=('gre','gpa'),vert = False)
从结果来看,由于gpa的取值范围是0~4,而gre的取值范围是0~800,二者绘制在一张图上使得gpa的箱线图被过分压缩,并不合适,因此需要单独绘制二者的箱线图。
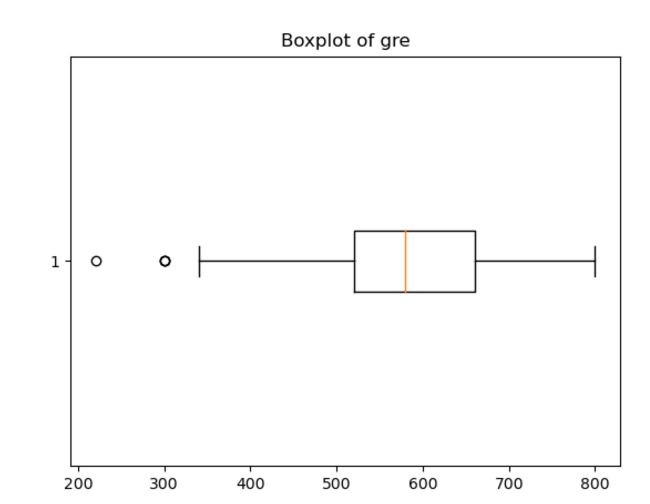
#绘制gre的箱线图
import matplotlib.pyplot as plt
plt.boxplot(x = data['gre'],vert = False)
plt.title('Boxplot of gre')
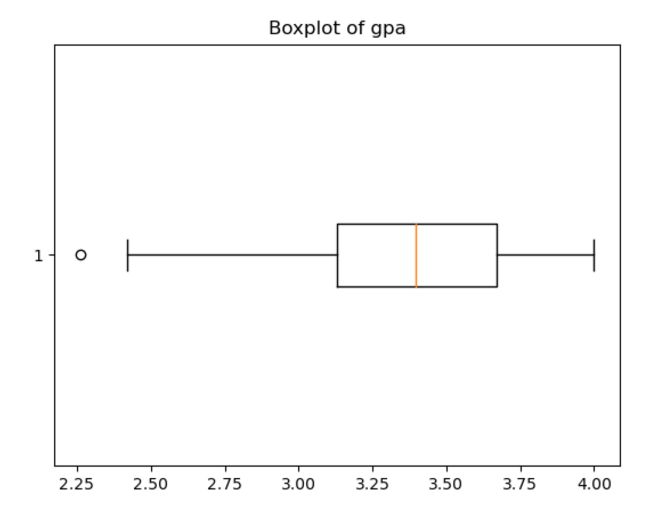
#绘制gpa的箱线图
import matplotlib.pyplot as plt
plt.boxplot(x = data['gpa'],vert = False)
plt.title('Boxplot of gpa')
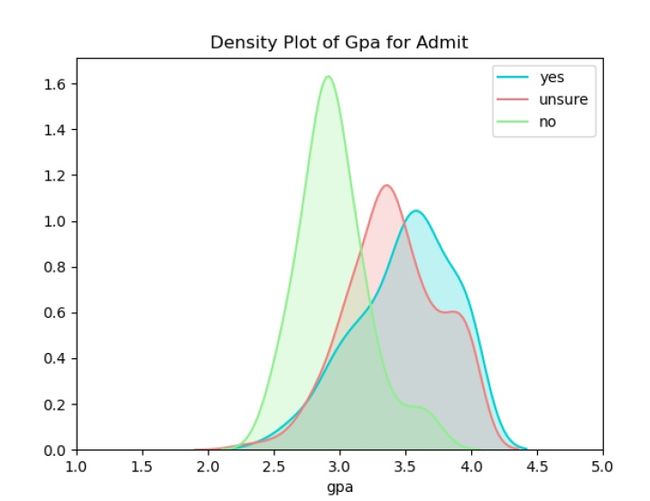
(10)绘制录不同取状态对应的gpa密度曲线
import matplotlib.pyplot as plt
import seaborn as sns
ax = sns.kdeplot(data['gpa'][data.admit==1],color='darkturquoise',shade=True)
sns.kdeplot(data['gpa'][data.admit==0],color='lightcoral',shade=True)
sns.kdeplot(data['gpa'][data.admit == -1], color='lightgreen', shade=True)
plt.legend(['yes','unsure','no'])
plt.title('Density Plot of Gpa for Admit')
ax.set(xlabel='gpa')
plt.xlim(1,5) #x轴取值范围
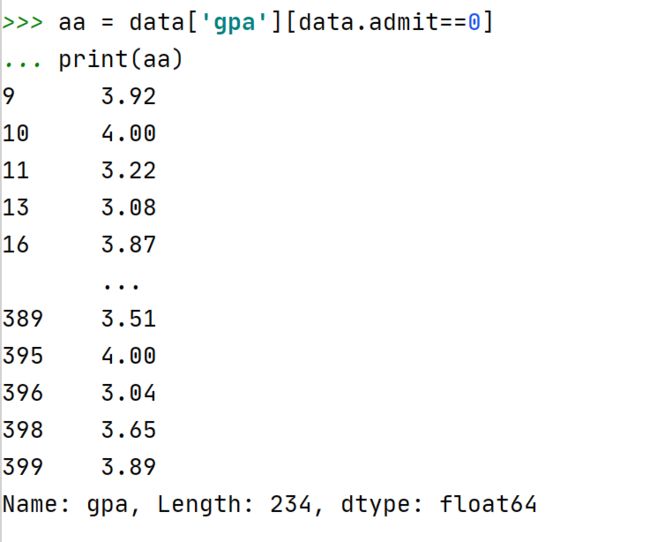
这里需要注意数据框的一种数据筛选方式:如,筛选admit列值为0的gpa数据。
3.使用逻辑回归进行建模
(1)将性别映射为0和1
这么做是因为预测模型的输入对象必须是数值,不能是字符。
data['gender'] = data.gender.map({'M':0,'F':1})
#创建x和y
col = ['gre','gpa','gender','prestige']
x = data[col]
y = data['admit']
(2)生成训练集和测试集
x_train,x_test,y_train,y_test = model_selection.train_test_split(x,y,test_size=0.2,random_state=1)
#为了使我的分析结果可被复现,需要保证每次随机抽取到的数据集是同一批数据,所以我们设置了random_state,只要指定了相同的random_state值,就可以抽取到同一批数据
(3)使用逻辑回归建模
lr = LogisticRegression(multi_class='multinomial',solver='lbfgs',class_weight='balanced',max_iter=1000)
#For multiclass problems, only 'newton-cg', 'sag', 'saga' and 'lbfgs' handle multinomial loss
lr.fit(x_train,y_train) ##拟合模型
score = lr.score(x_train,y_train)
print(score)
#结果:0.55625
说明:①多分类问题一定要设置multi_class='multinomial'。
②solver参数决定了我们对逻辑回归损失函数的优化方法,有4种算法可以选择,分别是:
a) liblinear:使用了开源的liblinear库实现,内部使用了坐标轴下降法来迭代优化损失函数。
b) lbfgs:拟牛顿法的一种,利用损失函数二阶导数矩阵即海森矩阵来迭代优化损失函数。
c) newton-cg:也是牛顿法家族的一种,利用损失函数二阶导数矩阵即海森矩阵来迭代优化损失函数。
d) sag:即随机平均梯度下降,是梯度下降法的变种,和普通梯度下降法的区别是每次迭代仅仅用一部分的样本来计算梯度,适合于样本数据多的时候。
从上面的描述可以看出,newton-cg, lbfgs和sag这三种优化算法时都需要损失函数的一阶或者二阶连续导数,因此不能用于没有连续导数的L1正则化,只能用于L2正则化。而liblinear通吃L1正则化和L2正则化。
同时,sag每次仅仅使用了部分样本进行梯度迭代,所以当样本量少的时候不要选择它,而如果样本量非常大,比如大于10万,sag是第一选择。但是sag不能用于L1正则化,所以当你有大量的样本,又需要L1正则化的话就要自己做取舍了。要么通过对样本采样来降低样本量,要么回到L2正则化。
另外,在使用不同的solver时,会遇到不聚合的情况,报错如下:
ConvergenceWarning: The max_iter was reached which means the coef_ did not converge warnings.warn("The max_iter was reached which means "
此时,可以增大最大迭代次数来解决,如设置max_iter=2000,默认设置为max_iter=100。
③class_weight='balanced'用于平衡数据集的类别信息。模型自动根据训练样本量计算权重,样本数目越多,权重越小,样本数越少,权重越大。
参考:
sklearn 逻辑回归中的参数的详解'newton-cg', 'lbfgs', 'liblinear', 'sag', 'saga'blog.csdn.net在实际应用中,如银行欺诈分类,我们往往会在意错误将欺诈的人预测为不欺诈这类错误问题,可以在实例化LogisticRegression类的时候,设置class_weight={0:0.3, 1:0.7},0表示不欺诈,1表示欺诈,提高欺诈类的权重。
这里,为了保守起见,我们认为,在预测一个申请者是否会被录取时,我们倾向于悲观估计,于是将-1的权重提高。
lr = LogisticRegression(multi_class='multinomial',solver='lbfgs',max_iter=1000,class_weight={-1:0.4,0:0.3,1:0.3})
lr.fit(x_train,y_train) ##拟合模型
(4)查看自变量系数:
print(lr.coef_)
#结果:
[[-0.00751727 -1.20321394  0.1484815  -0.21883866]#模型1
 [ 0.00318075  0.44605193  0.17910411  0.41009938]#模型2
 [ 0.00433652  0.75716201 -0.32758561 -0.19126072]#模型3]
由于是三分类问题(-1,0,1),所以生成了三行变量系数。
(5)查看截距项:
print(lr.intercept_)
#结果:
[ 7.56841843 -3.36903595 -4.19938248]
同理,由于是三分类问题(-1,0,1),所以生成了三个截距项系数。
(6)变量重要性排序
衡量变量的重要性,主要考虑变量的系数的绝对值大小,系数绝对值越大,则变量对于y的影响越大。
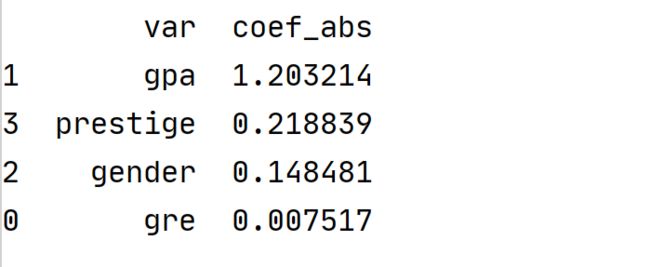
#模型1的变量重要性排序
coef_c1 = pd.DataFrame({'var' : pd.Series(x_test.columns),
                        'coef_abs' : abs(pd.Series(lr.coef_[0].flatten()))
                        })
coef_c1 = coef_c1.sort_values(by = 'coef_abs',ascending=False)
print(coef_c1)
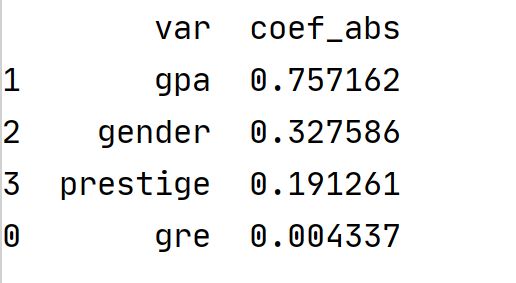
结果:
可以看出,对于分类模型1而言,gpa对于y(是否录取)的影响是最大的。
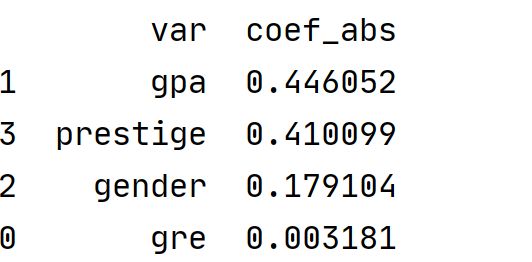
同理,可以查看模型2的各自变量重要性:
coef_c2 = pd.DataFrame({'var' : pd.Series(x_test.columns),
                        'coef_abs' : abs(pd.Series(lr.coef_[1].flatten()))
                        })
coef_c2 = coef_c2.sort_values(by = 'coef_abs',ascending=False)
print(coef_c2)
查看模型3的各自变量重要性:
coef_c3 = pd.DataFrame({'var' : pd.Series(x_test.columns),
                        'coef_abs' : abs(pd.Series(lr.coef_[2].flatten()))
                        })
coef_c3 = coef_c3.sort_values(by = 'coef_abs',ascending=False)
print(coef_c3)
(7)模型评价
①模型得分
score = lr.score(x_train,y_train)#Return the mean accuracy on the given test data and labels.
print(score)#0.628125

#模型在训练集上的得分
train_score = accuracy_score(y_train,lr.predict(x_train))
print(train_score)#0.628125

#模型在测试集上的得分
test_score = lr.score(x_test,y_test)
print(test_score)#0.6
②召回率
#训练集的召回率
train_recall = recall_score(y_train, lr.predict(x_train), average='macro')
print(train_recall)#0.47934382086167804
#测试集的召回率
test_recall = recall_score(y_test, lr.predict(x_test), average='macro')
print(test_recall)#0.5002736726874658
③交叉验证得分
#k-fold交叉验证得分
from sklearn.model_selection import cross_val_score
scores = cross_val_score(lr,x_train,y_train,cv=10,scoring='accuracy')
print('每一次的得分',scores)
#结果:每一次的得分 [0.59375 0.59375 0.6875  0.59375 0.53125 0.5625  0.65625 0.625   0.71875 0.625  ]
print('平均得分', scores.mean())
#结果:平均得分 0.61875
(8)预测
①预测样本属于各类别的概率
y_pro = lr.predict_proba(x_test) ##获取预测概率值
print(y_pro)
#结果:
#说明:第一列表示admit取-1的概率,第2列表示admit取0的概率,第3列表示admit取1的概率
[[0.01340428 0.63590904 0.35068668]
 [0.04227106 0.79143853 0.16629041]
 [0.08119269 0.63987417 0.27893314]
 [0.01619737 0.677126   0.30667662]
 [0.01280188 0.67388084 0.31331729]
 [0.02516892 0.78644278 0.18838829]
 ……
 [0.00244047 0.47065902 0.52690052]
 [0.06825543 0.53918888 0.39255569]
 [0.39115159 0.29246516 0.31638324]
 [0.03231264 0.52739218 0.44029518]
 [0.07292472 0.53929682 0.38777846]
 [0.01468909 0.66744996 0.31786095]
 [0.06386224 0.53888812 0.39724963]
 [0.01396618 0.54367437 0.44235945]]
②预测样本属于哪个具体类别
y_predict = lr.predict(x_test)
print(y_predict)
#结果:
#对比上面的概率值可以发现,LR算法是基于概率最大原则进行类别划分的,即选择3个类别中概率值最大的那个类别作为预测类别
[ 0  0  0  0  0  0  0  0  1  0  0  1  0  0  0  0  0  0  1  0  0  0  0  0
 -1  1  0  0  1  0  0  0  1  0  1  0  0  0 -1  1  0  1  0  0 -1  0  0  0
  0  0  0  0  0  1  0  1  0  0  0  1  0  1  1  0  0 -1  0  0  0  0 -1  0
  1  0 -1  0  0  0  0  0]
③混淆矩阵
from sklearn.preprocessing import LabelEncoder
from sklearn.metrics import confusion_matrix
import pandas as pd
labelEncoder = LabelEncoder()
labelEncoder.fit(y)##对变量y进行硬编码,将标签变为数字
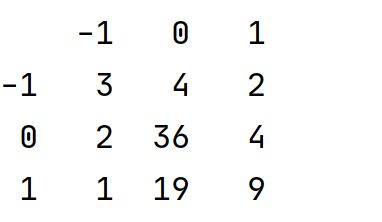
cm = confusion_matrix(y_test, y_predict)
cm_pd = pd.DataFrame(data = cm,columns=labelEncoder.classes_, index=labelEncoder.classes_)
print(cm_pd)
结果:
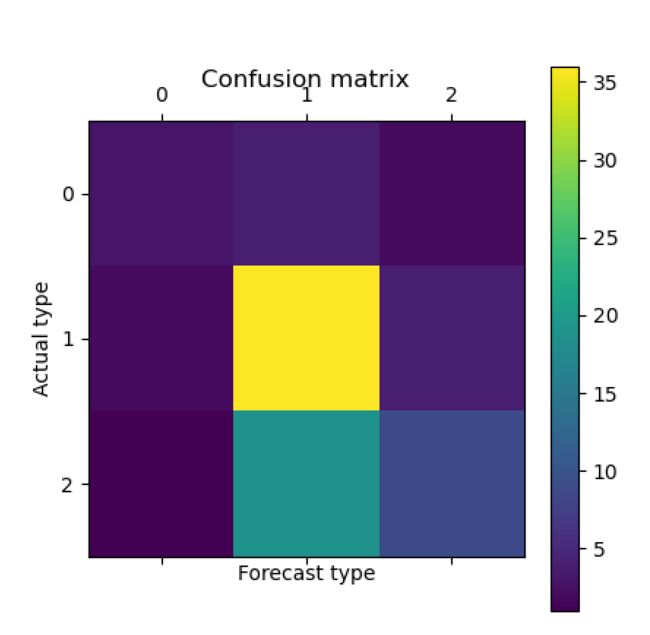
绘制混淆矩阵图形
import matplotlib.pyplot as plt
plt.matshow(confusion_matrix(y_test, y_predict))
plt.title('Confusion matrix')
plt.colorbar()
plt.ylabel('Actual type') #实际类型
plt.xlabel('Forecast type') #预测类型
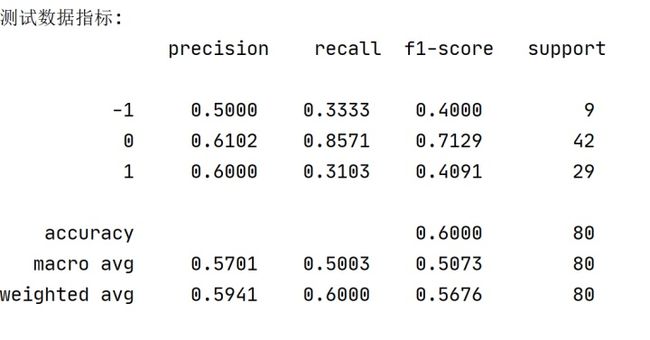
④查看各类得分情况
from sklearn.metrics import classification_report
print('测试数据指标:n',classification_report(y_test,y_predict,digits=4))
逻辑回归多分类模型预测公式如何书写?不少大佬说是使用softmax函数进行分类预测,即根据前面训练出来的3对系数,带入softmax函数,得到样本i属于3个类别的3个概率值,选择概率值最大的类别作为最终预测类别。
