import pandas as pd
import numpy as np
import statsmodels.api as sm
import statsmodels.formula.api as smf
import statsmodels.tsa.api as smt
import matplotlib.pylab as plt
import seaborn as sns
pd.set_option('display.float_format', lambda x: '%.5f' % x)
np.set_printoptions(precision=5, suppress=True)
pd.set_option('display.max_columns', 100)
pd.set_option('display.max_rows', 100)
sns.set(style='ticks', context='poster')
filename_ts = 'data/series1.csv'
ts_df = pd.read_csv(filename_ts, index_col=0, parse_dates=[0])

n_sample = ts_df.shape[0]
print(ts_df.shape)
print(ts_df.head())
(120, 1)
              value
2006-06-01  0.21507
2006-07-01  1.14225
2006-08-01  0.08077
2006-09-01 -0.73952
2006-10-01  0.53552
n_train = int(0.95 * n_sample) + 1
n_forecast = n_sample - n_train
ts_train = ts_df.iloc[:n_train]['value']
ts_test = ts_df.iloc[n_train:]['value']
print(ts_train.shape)
print(ts_test.shape)
print("Training Series:", "\n", ts_train.tail(), "\n")
print("Testing Series:", "\n", ts_test.head())
(115,)
(5,)
Training Series:
 2015-08-01    0.60371
2015-09-01   -1.27372
2015-10-01   -0.93284
2015-11-01    0.08552
2015-12-01    1.20534
Name: value, dtype: float64

Testing Series:
 2016-01-01    2.16411
2016-02-01    0.95226
2016-03-01    0.36485
2016-04-01   -2.26487
2016-05-01   -2.38168
Name: value, dtype: float64
def tsplot(y, lags=None, title='', figsize=(14, 8)):

    fig = plt.figure(figsize=figsize)
    layout = (2, 2)
    ts_ax   = plt.subplot2grid(layout, (0, 0))
    hist_ax = plt.subplot2grid(layout, (0, 1))
    acf_ax  = plt.subplot2grid(layout, (1, 0))
    pacf_ax = plt.subplot2grid(layout, (1, 1))

    y.plot(ax=ts_ax)
    ts_ax.set_title(title)
    y.plot(ax=hist_ax, kind='hist', bins=25)
    hist_ax.set_title('Histogram')
    smt.graphics.plot_acf(y, lags=lags, ax=acf_ax)
    smt.graphics.plot_pacf(y, lags=lags, ax=pacf_ax)
    [ax.set_xlim(0) for ax in [acf_ax, pacf_ax]]
    sns.despine()
    fig.tight_layout()
    return ts_ax, acf_ax, pacf_ax
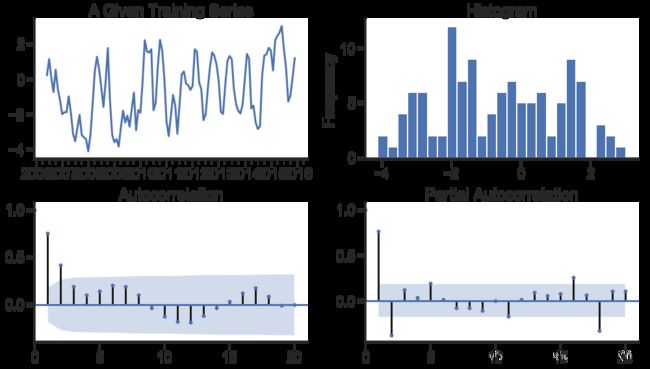
tsplot(ts_train, title='A Given Training Series', lags=20)
(,
 ,
 )

arima200 = sm.tsa.SARIMAX(ts_train, order=(2,0,0))
model_results = arima200.fit()
C:\ProgramData\Anaconda3\lib\site-packages\statsmodels\tsa\base\tsa_model.py:171: ValueWarning: No frequency information was provided, so inferred frequency MS will be used.
  % freq, ValueWarning)
import itertools
p_min = 0
d_min = 0
q_min = 0
p_max = 4
d_max = 0
q_max = 4
results_bic = pd.DataFrame(
index=['AR{}'.format(i) for i in range(p_min, p_max + 1)],
columns=['MA{}'.format(i) for i in range(q_min, q_max + 1)])
for p, d, q in itertools.product(
range(p_min, p_max + 1), range(d_min, d_max + 1),
range(q_min, q_max + 1)):
if p == 0 and d == 0 and q == 0:
results_bic.loc['AR{}'.format(p), 'MA{}'.format(q)] = np.nan
continue
try:
model = sm.tsa.SARIMAX(
ts_train,
order=(p, d, q),
)
results = model.fit()
results_bic.loc['AR{}'.format(p), 'MA{}'.format(q)] = results.bic
except:
continue
results_bic = results_bic[results_bic.columns].astype(float)
fig, ax = plt.subplots(figsize=(10, 8))
ax = sns.heatmap(results_bic,
                 mask=results_bic.isnull(),
                 ax=ax,
                 annot=True,
                 fmt='.2f',
                 );
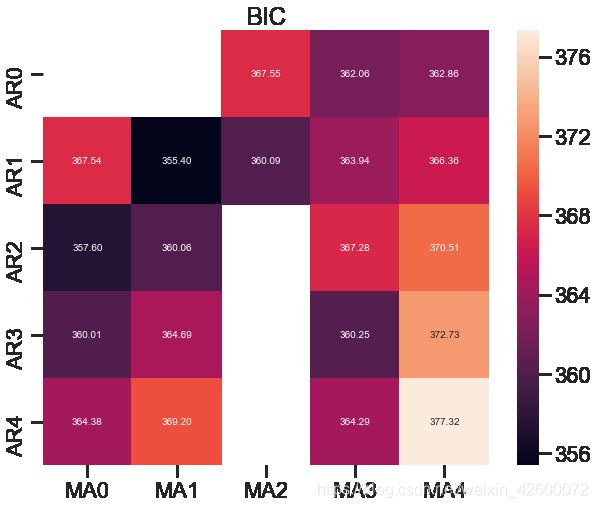
ax.set_title('BIC');

train_results = sm.tsa.arma_order_select_ic(
ts_train, ic=['aic', 'bic'], trend='nc', max_ar=4, max_ma=4)
print('AIC', train_results.aic_min_order)
print('BIC', train_results.bic_min_order)
AIC (4, 2)
BIC (1, 1)
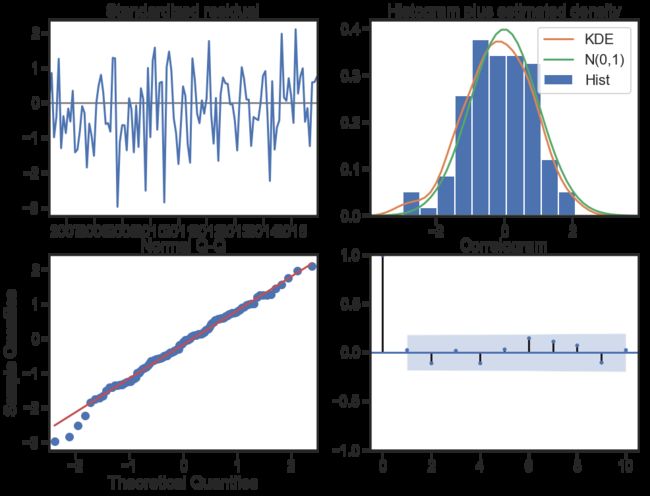
model_results.plot_diagnostics(figsize=(16, 12));


