ggstatsplot | 一个满足你日常统计需求的高颜值R包(三)
ggstatsplot | 一个满足你日常统计需求的高颜值R包(三)
1. 写在前面
在描述变量的分布情况时,我们可以根据变量的类型,采用不同的方式进行展示,如直方图、饼图、柱状图等。
本期使用
ggstatsplot中的函数进行统计分析 ^_~
2. 加载需要的R包
rm(list=ls())
library(tidyverse)
library(ggstatsplot)
library(ggsci)
library(psych)
3. 示例数据
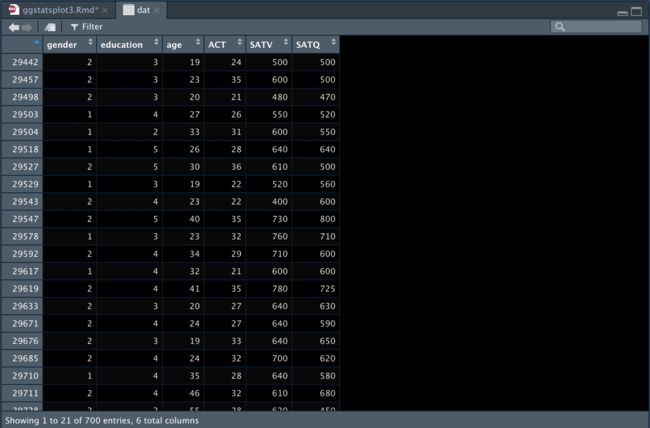
dat <- psych::sat.act
4. 直方图展示数据分布
本次用到的函数是
gghistostats和grouped_gghistostats,
当想要观察连续变量的分布情况时,我们可以这样做( 。_ 。) ✎ _
4.1 初步绘图
gghistostats(
  data = dat,
  x = ACT, ## numeric variable
  xlab = "ACT Score", ## x-axis label
  title = "Distribution of ACT Scores", ## title for the plot
  test.value = 20, ## test value
  caption = ""
)
4.2 复杂分组绘图
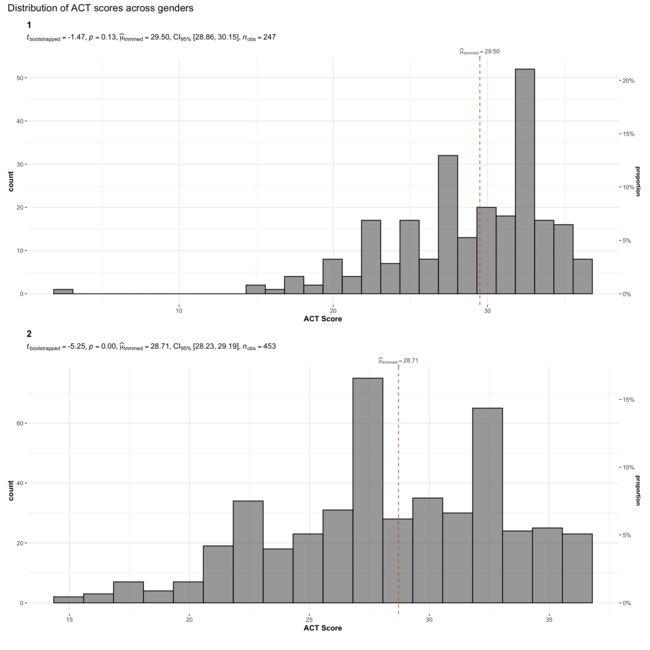
利用grouped_gghistostats函数进行复杂分组比较,这里将gender定义为分组参数
grouped_gghistostats(
  ## arguments relevant for gghistostats
  data = dat,
  x = ACT, ## same outcome variable
  xlab = "ACT Score",
  grouping.var = gender, ## grouping variable males = 1, females = 2
  type = "robust", ## robust test: one-sample percentile bootstrap
  test.value = 30, ## test value against which sample mean is to be compared
  centrality.line.args = list(color = "#D55E00", linetype = "dashed"),
  # ggtheme = ggthemes::theme_stata(), ## changing default theme
  ## turn off ggstatsplot theme layer
  ## arguments relevant for combine_plots
  annotation.args = list(
    title = "Distribution of ACT scores across genders",
    caption = ""
  ),
  plotgrid.args = list(nrow = 2)
)
5. 饼图展示数据分布
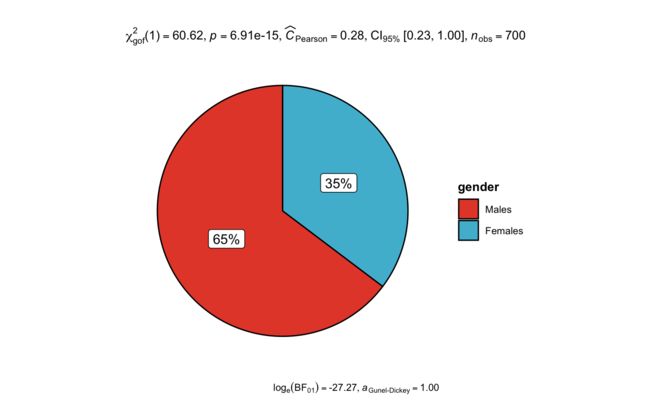
当想要观察分类变量的分布情况,并通过卡方检验进行率的比较时,可以用
ggpiestats函数
5.1 初步绘图
ggpiestats(
  data = dat,
  x = gender,
  title = "",
  caption = "",
  legend.title = "gender"
) +
  scale_fill_npg(labels=c("Males", "Females"))
5.2 复杂分组绘图1
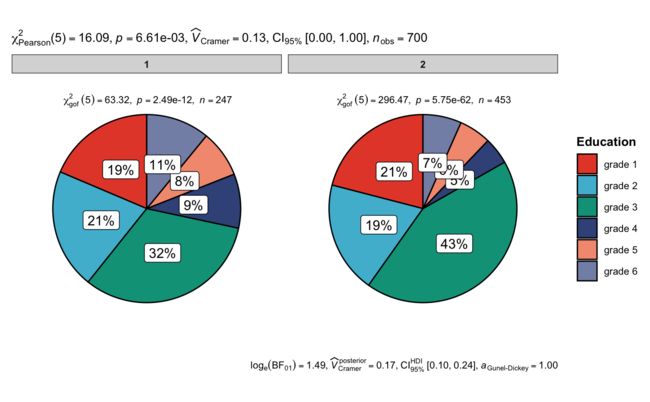
我们看一下不同gender的education分布情况
ggpiestats(
  data = dat,
  x = education,
  y = gender,
  legend.title = "Education"
) + # further modification with `{ggplot2}` commands
  ggplot2::theme(
    plot.title = ggplot2::element_text(
      color = "black",
      size = 14,
      hjust = 0
    )
  )+
  scale_fill_npg(labels=c("grade 1", "grade 2", "grade 3",
                          "grade 4", "grade 5", "grade 6"))
5.3 复杂分组绘图2
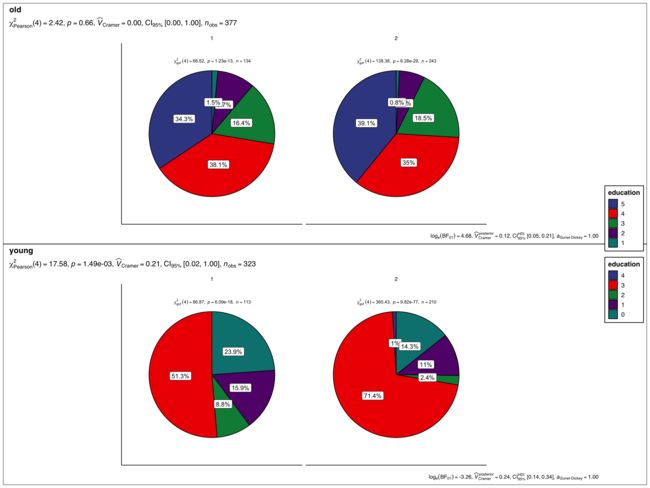
我们再使用grouped_ggpiestats在再加一个分组变量的情况下, 看一下不同Age及不同gender的education的分布情况
# 这里我们新增一列Age
dat <- dat %>%
  dplyr::mutate(.,Age = ifelse(age >= median(age), "old", "young"))

grouped_ggpiestats(
  data = dat,
  x = education,
  y = gender,
  grouping.var = Age,
  perc.k = 1,
  package = "ggsci",
  palette = "default_aaas",
  # arguments relevant for `combine_plots()`
  title.text = "",
  caption.text = "",
  ggtheme = ggthemes::theme_clean(),
  plotgrid.args = list(nrow = 2)
)
6. 堆叠柱状图展示数据分布
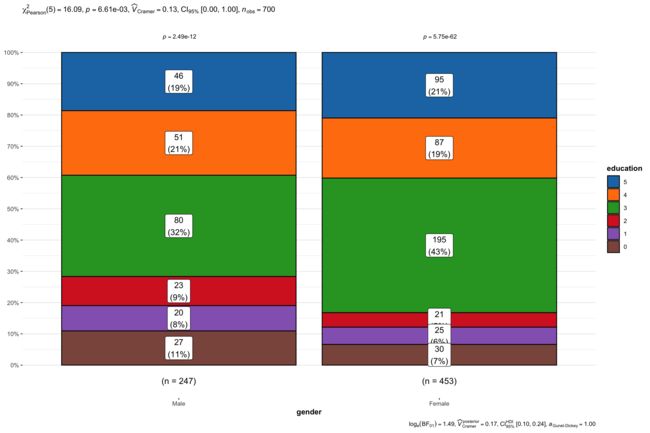
这里用到的是ggbarstats函数, 功能与ggpiestats相似,只是展示方式不同
6.1 初步绘制
ggbarstats(dat,
           x = education,
           y = gender,
           label = "both", #
           label.text.size = 20, #字体大小
           label.args = list(alpha = 1, fill = "white"),
           package = "ggsci",
           palette = "category10_d3",
           ) +
  scale_x_discrete(labels =  c("Male", "Female"))
6.2 复杂分组绘制堆叠柱状图
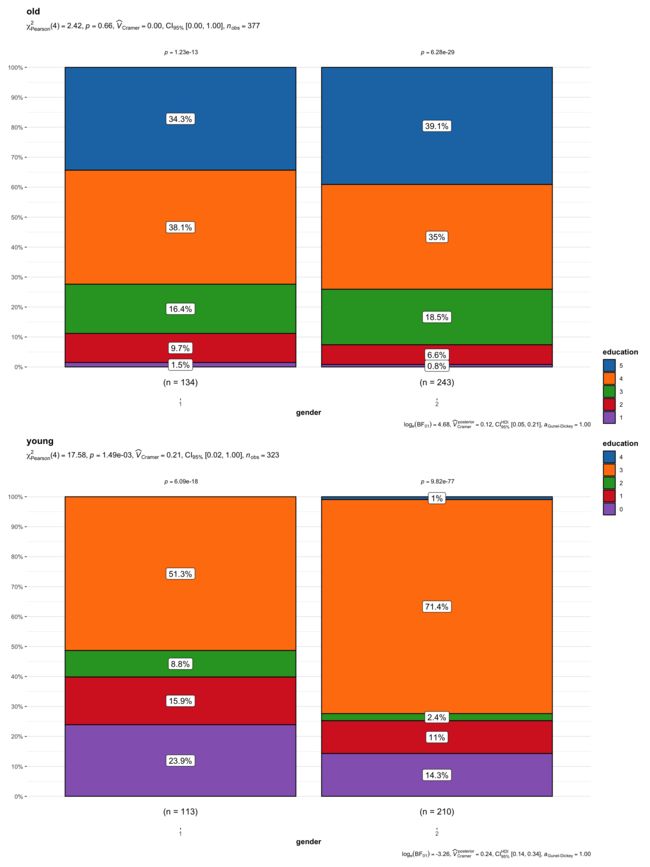
用到的是grouped_ggbarstats,
比较一下不同Age及不同gender的education的分布情况
grouped_ggbarstats(
  data = dat,
  x = education,
  y = gender,
  grouping.var = Age,
  perc.k = 1,
  package = "ggsci",
  palette = "category10_d3",
  # arguments relevant for `combine_plots()`
  title.text = "",
  caption.text = "",
  plotgrid.args = list(nrow = 2)
)
点个在看吧各位~ ✐.ɴɪᴄᴇ ᴅᴀʏ 〰
