数据挖掘--糖尿病遗传风险检测
文章目录
- 赛事背景
- 数据特征介绍
- 数据处理
-
- 导入数据并查看
- 分析数据
- 数据清洗
- 特征工程
- 构建模型
-
- 建立训练数据集和测试数据集
- 构建模型
赛事背景
截至2022年,中国糖尿病患者近1.3亿。中国糖尿病患病原因受生活方式、老龄化、城市化、家族遗传等多种因素影响。同时,糖尿病患者趋向年轻化。
糖尿病可导致心血管、肾脏、脑血管并发症的发生。因此,准确诊断出患有糖尿病个体具有非常重要的临床意义。糖尿病早期遗传风险预测将有助于预防糖尿病的发生。
根据《中国2型糖尿病防治指南(2017年版)》,糖尿病的诊断标准是具有典型糖尿病症状(烦渴多饮、多尿、多食、不明原因的体重下降)且随机静脉血浆葡萄糖≥11.1mmol/L或空腹静脉血浆葡萄糖≥7.0mmol/L或口服葡萄糖耐量试验(OGTT)负荷后2h血浆葡萄糖≥11.1mmol/L。
在这次比赛中,您需要通过训练数据集构建糖尿病遗传风险预测模型,然后预测出测试数据集中个体是否患有糖尿病,和我们一起帮助糖尿病患者解决这“甜蜜的烦恼”。
数据特征介绍
| Attribute | Definition |
|---|---|
| 编号 | 标识个体身份的数字 |
| 性别 | 1表示男性,0表示女性 |
| 出生年份 | 出生年份 |
| 体重指数 | (体重)/(身高的平方),kg/m^2 |
| 糖尿病家族史 | 标识糖尿病的遗传特性,记录家族里面患有糖尿病的家属,分成三种标识,分别是父母有一方患有糖尿病、叔叔或者姑姑有一方患有糖尿病、无记录 |
| 舒张压 | 心脏舒张时,动脉血管弹性回缩时,产生的压力称为舒张压,单位mmHg |
| 口服耐糖量测试 | 诊断糖尿病的一种实验室检查方法,采用120分钟耐糖测试后的血糖值,单位mmol/L |
| 胰岛素释放实验 | 空腹时定量口服葡萄糖刺激胰岛β细胞释放胰岛素,采用服糖后120分钟的血浆胰岛素水平,单位pmol/L |
| 肱三头肌皮褶厚度 | 在右上臂后面肩峰与鹰嘴连线的重点处,夹取与上肢长轴平行的皮褶,纵向测量,单位mm |
| 患有糖尿病标识 | 1表示患有糖尿病,0表示未患有糖尿病 |
数据处理
导入数据并查看
import pandas as pd
# 导入训练数据集及测试数据集
train_data = pd.read_csv('E:/DocumentFile/data/糖尿病遗传风险预测挑战赛公开数据/比赛训练集.csv')
test_data = pd.read_csv('E:/DocumentFile/data/糖尿病遗传风险预测挑战赛公开数据/糖尿病遗传风险预测挑战赛b榜新数据集.csv')
print("训练数据集:", train_data.shape, "测试数据集", test_data.shape)
# 查看训练数据
train_data.head()
# 浏览数据的基本信息
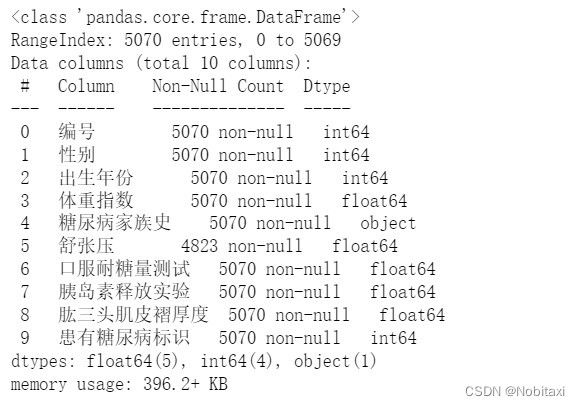
train_data.info()
分析数据
# 分析性别与是否患糖尿病的关系
Sex_Patient = pd.concat([train_data['患有糖尿病标识'], train_data['性别']], axis=1)
print(Sex_Patient.value_counts())
import matplotlib.pyplot as plt
plt.figure()
plt.rcParams['font.family'] = ['SimHei']
x = ['男', '女']
y1 = [923, 1013]
y2 = [1393, 1741]
plt.bar(range(2), y1, width=0.2, facecolor='red', label='糖尿病患者')
plt.bar([i+0.2 for i in range(2)], y2, width=0.2, facecolor='greenyellow', label='非糖尿病患者')
plt.xticks([i+0.1 for i in range(2)], x)
for a, b in zip(range(2), y1):
    plt.text(a, b + 0.05, '%.0f' % b, ha='center', va='bottom', fontsize=10)
for a, b in zip([i+0.2 for i in range(2)], y2):
    plt.text(a, b + 0.05, '%.0f' % b, ha='center', va='bottom', fontsize=10)
plt.ylabel('人数')
plt.legend()
plt.show()

由此可见,在5070例样本中,男性共2316人,女性共2754人;男性患者923人,占男性比例约为40%;女性患者1013人,占女性比例约为37%。
# 分析出生年份与是否患糖尿病的关系
Birth_Patient = pd.concat([train_data['患有糖尿病标识'], train_data['出生年份']],axis=1)
Birth_OnPatient = Birth_Patient[Birth_Patient['患有糖尿病标识'] == 1]['出生年份'].value_counts()
Birth_NonPatient = Birth_Patient[Birth_Patient['患有糖尿病标识'] == 0]['出生年份'].value_counts()
x1 = Birth_OnPatient.index
y1 = Birth_OnPatient.values
x2 = Birth_NonPatient.index
y2 = Birth_NonPatient.values
plt.scatter(x1, y1, c='r', label='糖尿病患者')
plt.scatter(x2, y2, alpha=0.6, label='非糖尿病患者')
plt.xlabel('出生年份')
plt.ylabel('糖尿病患者数量')
plt.legend()
plt.show()
# 分析体重指数与是否患糖尿病的关系
Weight_Patient = pd.concat([train_data['患有糖尿病标识'], train_data['体重指数']], axis=1)
Weight_OnPatient = Weight_Patient[Weight_Patient['患有糖尿病标识'] == 1]['体重指数'].value_counts()
Weight_NonPatient = Weight_Patient[Weight_Patient['患有糖尿病标识'] == 0]['体重指数'].value_counts()
x1 = Weight_OnPatient.index
y1 = Weight_OnPatient.values
x2 = Weight_NonPatient.index
y2 = Weight_NonPatient.values
plt.figure()
plt.scatter(x1, y1, c='r', label='糖尿病患者')
plt.scatter(x2, y2, alpha=0.6, label='非糖尿病患者')
plt.xlabel('体重指数')
plt.ylabel('人数')
plt.legend()
plt.show()
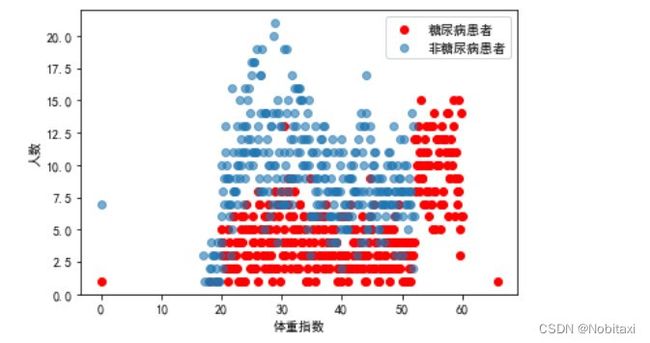
由此可见,体重指数越高,越容易患糖尿病。
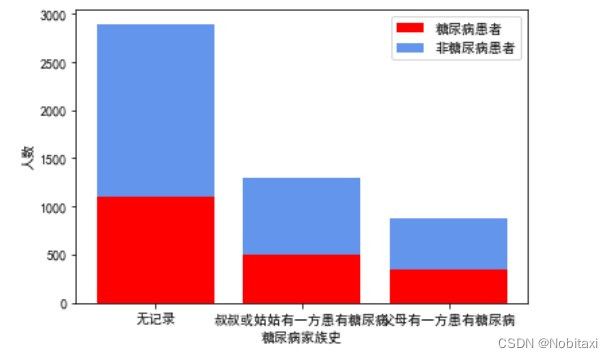
因为数据中有‘叔叔或姑姑有一方患有糖尿病’和‘叔叔或者姑姑有一方患有糖尿病’,需要做一个简单的替换。
# 分析糖尿病家族史与是否患糖尿病的关系
Family_Patient = pd.concat([train_data['患有糖尿病标识'], train_data['糖尿病家族史']], axis=1)
Family_Patient = Family_Patient.replace('叔叔或者姑姑有一方患有糖尿病', '叔叔或姑姑有一方患有糖尿病')
Family_OnPatient = Family_Patient[Family_Patient['患有糖尿病标识'] == 1]['糖尿病家族史'].value_counts()
Family_OnPatient
Family_NonPatient = Family_Patient[Family_Patient['患有糖尿病标识'] == 0]['糖尿病家族史'].value_counts()
Family_NonPatient
import numpy as np
x = ['无记录', '叔叔或姑姑有一方患有糖尿病', '父母有一方患有糖尿病']
y1 = [1101, 495, 340]
y2 = [1796, 803, 535]
plt.figure()
plt.bar(np.arange(len(x)), y1, facecolor='red', label='糖尿病患者')
plt.bar(np.arange(len(x)), y2, facecolor='cornflowerblue', bottom=y1, label='非糖尿病患者')
plt.xticks([i for i in np.arange(len(x))], x)
plt.xlabel('糖尿病家族史')
plt.ylabel('人数')
plt.legend()
plt.show()
# 分析舒张压与是否患糖尿病的关系
Pressure_Patient = pd.concat([train_data['患有糖尿病标识'], train_data['舒张压']], axis=1)
Pressure_OnPatient = Pressure_Patient[Pressure_Patient['患有糖尿病标识'] == 1]['舒张压'].value_counts()
Pressure_NonPatient = Pressure_Patient[Pressure_Patient['患有糖尿病标识'] == 0]['舒张压'].value_counts()
x1 = Pressure_OnPatient.index
y1 = Pressure_OnPatient.values
x2 = Pressure_NonPatient.index
y2 = Pressure_NonPatient.values
plt.figure()
plt.scatter(x1, y1, c='r', label='糖尿病患者')
plt.scatter(x2, y2, alpha=0.6, label='非糖尿病患者')
plt.xlabel('舒张压')
plt.ylabel('人数')
plt.legend()
plt.show()
# 分析口服耐糖量测试与是否患糖尿病的关系
Sugar_Patient = pd.concat([train_data['患有糖尿病标识'], train_data['口服耐糖量测试']], axis=1)
Sugar_OnPatient = Sugar_Patient[Sugar_Patient['患有糖尿病标识'] == 1]['口服耐糖量测试'].value_counts()
Sugar_NonPatient = Sugar_Patient[Sugar_Patient['患有糖尿病标识'] == 0]['口服耐糖量测试'].value_counts()
x1 = Sugar_OnPatient.index
y1 = Sugar_OnPatient.values
x2 = Sugar_NonPatient.index
y2 = Sugar_NonPatient.values
plt.figure()
plt.scatter(x1, y1, c='r', alpha=0.5, label='糖尿病患者')
plt.xlabel('口服耐糖量测试后的血糖值')
plt.ylabel('人数')
plt.legend()
plt.show()
plt.scatter(x2, y2, alpha=0.5, label='非糖尿病患者')
plt.xlabel('口服耐糖量测试后的血糖值')
plt.ylabel('人数')
plt.legend()
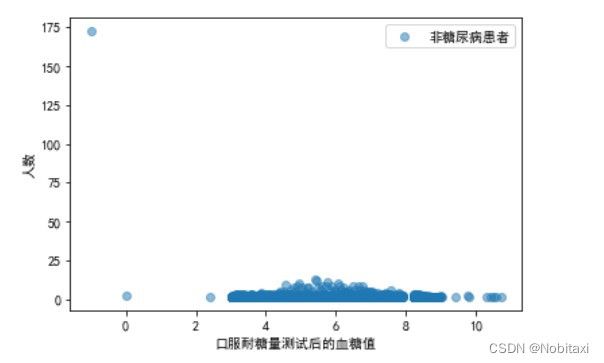
由此可见,当血糖值>8时,患糖尿病患者明显多于非糖尿病患者。并且<=0的都为异常值。
# 分析胰岛素释放实验与是否患糖尿病的关系
Insulin_Patient = pd.concat([train_data['患有糖尿病标识'], train_data['胰岛素释放实验']], axis=1)
Insulin_OnPatient = Insulin_Patient[Insulin_Patient['患有糖尿病标识'] == 1]['胰岛素释放实验'].value_counts()
Insulin_NonPatient = Insulin_Patient[Insulin_Patient['患有糖尿病标识'] == 0]['胰岛素释放实验'].value_counts()
x1 = Insulin_OnPatient.index
y1 = Insulin_OnPatient.values
x2 = Insulin_NonPatient.index
y2 = Insulin_NonPatient.values
plt.figure()
plt.scatter(x1, y1, c='r', alpha=0.5, label='糖尿病患者')
plt.xlabel('胰岛素释放实验后的血浆胰岛素水平')
plt.ylabel('人数')
plt.legend()
plt.show()
plt.scatter(x2, y2, alpha=0.5, label='非糖尿病患者')
plt.xlabel('胰岛素释放实验后的血浆胰岛素水平')
plt.ylabel('人数')
plt.legend()
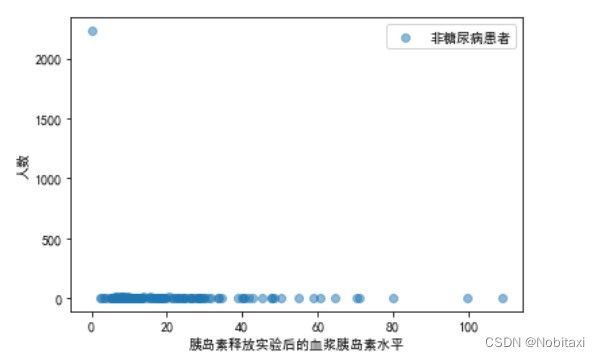
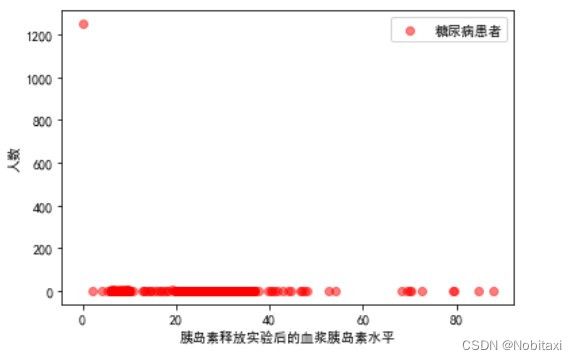
对比可知,两者没有明显的差距,并且为0的数据过多,这属于异常数据。
# 分析肱三头肌皮褶厚度与是否患糖尿病的关系
Skinfold_Patient = pd.concat([train_data['患有糖尿病标识'], train_data['肱三头肌皮褶厚度']], axis=1)
Skinfold_OnPatient = Skinfold_Patient[Skinfold_Patient['患有糖尿病标识'] == 1]['肱三头肌皮褶厚度'].value_counts()
Skinfold_NonPatient = Skinfold_Patient[Skinfold_Patient['患有糖尿病标识'] == 0]['肱三头肌皮褶厚度'].value_counts()
x1 = Skinfold_OnPatient.index
y1 = Skinfold_OnPatient.values
x2 = Skinfold_NonPatient.index
y2 = Skinfold_NonPatient.values
plt.figure()
plt.scatter(x1, y1, c='r', alpha=0.5, label='糖尿病患者')
plt.xlabel('肱三头肌皮褶厚度(单位:mm)')
plt.ylabel('人数')
plt.legend()
plt.show()
plt.scatter(x2, y2, alpha=0.5, label='非糖尿病患者')
plt.xlabel('肱三头肌皮褶厚度(单位:mm)')
plt.ylabel('人数')
plt.legend()
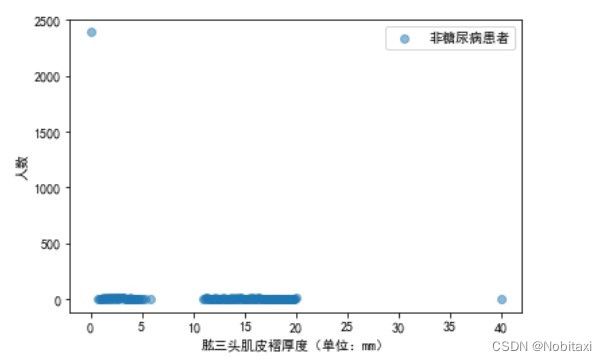
由此可见,当肱三头肌皮褶厚度>40时,糖尿病患者明显大于非糖尿病患者,0的数据过多,属于异常数据。
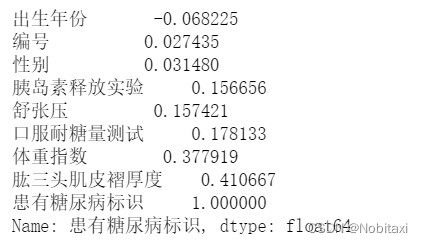
# 关系矩阵
corr_df = train_data.corr()
print(corr_df['患有糖尿病标识'].sort_values())
数据清洗
在上面的数据展示中,我们可以发现有少量的离群点,比如口服耐糖测后的血糖值有<=0的值,体重指数也有为0的。(应该也可以将其改为其他值,但我在此直接当作离群点删除)。
# 处理离群点
train_data.drop(train_data[train_data['口服耐糖量测试'] <= 0].index, inplace=True)
train_data.drop(train_data[(train_data['体重指数'] < 10) & (train_data['体重指数'] > 60)].index, inplace=True)
train_data = train_data.reset_index(drop=True)
这里需要reset_index,不然之后用到该数据时索引是不连续的。
# 合并数据集,方便同时对两个数据集进行清洗
full = pd.concat([train_data, test_data], axis=0, ignore_index=True)
full.shape
(8818,10)
full.info()
特征工程
- 新添加一个年龄属性,用来代替出生年份属性。
full['年龄'] = 2022 - full['出生年份']
full.drop('出生年份', axis=1, inplace=True)
- 对体重指数进行编码,采取规则如下:
BMI<18.5 (偏瘦);
18.5<=BMI<=23.9(正常);
24<=BMI<=26.9(偏胖);
27<=BMI<=29.9(肥胖);
30<=BMI<=39.9(重度肥胖);
40<=BMI(极重度肥胖)
def bmi(s):
    if s < 18.5:
        return 1
    elif 18.5 <= s <= 23.9:
        return 2
    elif 24 <= s <= 26.9:
        return 3
    elif 27 <= s <= 29.9:
        return 4
    elif 30 <= s <= 39.9:
        return 5
    else:
        return 6
full['体重指数'] = full['体重指数'].map(bmi)
- 对糖尿病家族史特征进行编码,因为测试集同样存在既有’叔叔或者姑姑有一方患有糖尿病’, 又有’叔叔或姑姑有一方患有糖尿病’的问题,我依旧采取替代(可以直接字典编码)。
full = full.replace('叔叔或者姑姑有一方患有糖尿病', '叔叔或姑姑有一方患有糖尿病')
full['糖尿病家族史'] = full['糖尿病家族史'].map({'无记录': 1, '叔叔或姑姑有一方患有糖尿病': 2, '父母有一方患有糖尿病': 3})
- 对舒张压特征进行编码,但由于舒张压存在缺失值,需要先进行填充,在此采用均值进行填充。编码采取如下规则:
舒张压<60(低血压);
60<=舒张压<=89(正常);
舒张压>=90(高血压)
full['舒张压'] = full['舒张压'].fillna(full['舒张压'].mean())
def pressure(s):
    if s < 60:
        return 1
    elif 60 <= s <= 89:
        return 2
    else:
        return 3
full['舒张压'] = full['舒张压'].map(pressure)
- 对口服耐糖量测试特征进行编码,采取如下规则:
血糖值<3.8(低血糖);
3.8<=血糖值<7.8(正常);
7.8<=血糖值<11(血糖受损或异常);
11<=血糖值(考虑为糖尿病)
def sugar(s):
    if s < 3.8:
        return 1
    elif 3.8 <= s < 7.8:
        return 2
    elif 7.8<= s < 11:
        return 3
    else:
        return 4
full['口服耐糖量测试'] = full['口服耐糖量测试'].map(sugar)
- 对胰岛素释放实验进行特征处理,由于0值过多,本该删除掉该特征,但考虑到本次数据特征并不多,于是还是选择进行填充,先将0值改为Nan,再进行缺失值处理。(肱三头肌皮褶厚度处理同样如此)
但不能单一的填充均值,于是我打算采用KNN进行填充。此处知识点可以参考: 在python中使用KNN算法处理缺失的数据
# 采取KNN归因
# 先找到最优的k值
from sklearn.impute import KNNImputer
from sklearn.model_selection import train_test_split
from sklearn.ensemble import RandomForestRegressor
from sklearn.metrics import mean_squared_error
rmse = lambda y, yhat: np.sqrt(mean_squared_error(y, yhat))
def optimize_k(data, target, columns):
    """
    1.使用当前的K值执行插补
    2.将数据集分为训练和测试子集
    3.拟合随机森林模型
    4.预测测试集
    5.使用RMSE进行评估
    :param data:
    :param target:
    :return:
    """
    errors = []
    for k in range(1, 20, 2):
        imputer = KNNImputer(n_neighbors=k)
        imputed = imputer.fit_transform(data)
        # df_imputed = pd.DataFrame(imputed, columns=['性别', '体重指数', '糖尿病家族史', '舒张压', '口服耐糖量测试', '胰岛素释放实验'])
        df_imputed = pd.DataFrame(imputed, columns=columns)

        X = df_imputed.drop(target, axis=1)
        y = df_imputed[target]
        X_train, X_test, y_train, y_test = train_test_split(X, y, test_size=0.2, random_state=42)

        model = RandomForestRegressor()
        model.fit(X_train, y_train)
        preds = model.predict(X_test)
        error = rmse(y_test, preds)
        errors.append({'K': k, 'RMSE': error})
    return errors
columns1 = ['性别', '体重指数', '糖尿病家族史', '舒张压', '口服耐糖量测试', '胰岛素释放实验']
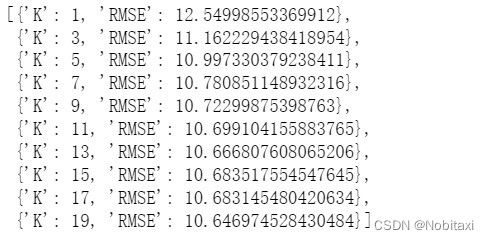
k_errors1 = optimize_k(data=full[columns1], target='胰岛素释放实验', columns=columns1)
k_errors1
# k=19误差最小
imputer = KNNImputer(n_neighbors=19)
imputed = imputer.fit_transform(full[columns1])
full['胰岛素释放实验'] = imputed[:, 5]
full['胰岛素释放实验'] = full['胰岛素释放实验'].map(lambda x: round(x, 2))# 保留两位小数
- 对肱三头肌皮褶厚度进行特征处理,和胰岛素特征处理方法相同,但是测试集该特征单位为cm,训练集该特征为mm,需要统一单位。
full.loc[:4817, '肱三头肌皮褶厚度'] = full.loc[:4817, '肱三头肌皮褶厚度'].map(lambda x: x/10)
full.iloc[full[full['肱三头肌皮褶厚度'] == 0].index, 7] = np.nan
columns2 = ['性别', '体重指数', '糖尿病家族史', '舒张压', '口服耐糖量测试', '肱三头肌皮褶厚度']
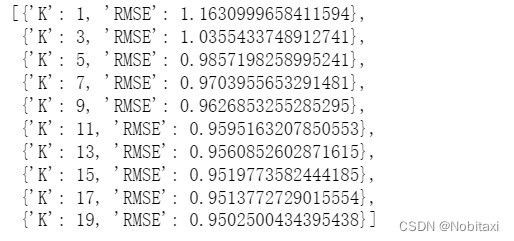
k_errors2 = optimize_k(data=full[columns2], target='肱三头肌皮褶厚度', columns=columns2)
k_errors2
# k=19误差最小
imputer = KNNImputer(n_neighbors=17)
imputed = imputer.fit_transform(full[columns2])
full['肱三头肌皮褶厚度'] = imputed[:, 5]
full['肱三头肌皮褶厚度'] = full['肱三头肌皮褶厚度'].map(lambda x: round(x, 2))
- 对年龄特征进行编码
def age(s):
    if s <= 18:
        return 1
    elif 19 <= s <= 30:
        return 2
    elif 31 <= s <= 50:
        return 3
    else:
        return 4
full['年龄'] = full['年龄'].map(age)
- 查看数据清洗后的结果
full.head()
full.drop(['编号', '患有糖尿病标识'], axis=1, inplace=True)
full.info()
构建模型
建立训练数据集和测试数据集
from sklearn.model_selection import train_test_split
source_X = full.loc[0:4817, :]
source_y = train_data.loc[0:4817, '患有糖尿病标识']
pred_X = full.loc[4818:, :]
train_X, test_X, train_y, test_y = train_test_split(source_X, source_y, train_size=0.8, random_state=0)
print('原始数据集特征:', source_X.shape, '训练数据集特征:', train_X.shape, '测试数据集特征:', test_X.shape)
print('原始数据集标签:', source_y.shape, '训练数据集标签:', train_y.shape, '测试数据集标签:', test_y.shape)
原始数据集特征: (4818, 8) 训练数据集特征: (3854, 8) 测试数据集特征: (964, 8)
原始数据集标签: (4818,) 训练数据集标签: (3854,) 测试数据集标签: (964,)
构建模型
# 随机森林
from sklearn.ensemble import RandomForestClassifier
from sklearn.model_selection import GridSearchCV
rfc=RandomForestClassifier(random_state=0)
params={'n_estimators':[50,100,150,200,250],'max_depth':[1,3,5,7,9,11,13,15,17,19],'min_samples_leaf':[2,4,6]}
best_model=GridSearchCV(rfc,param_grid=params,refit=True,cv=5).fit(train_X, train_y)
print('best parameters:',best_model.best_params_)
best parameters: {‘max_depth’: 7, ‘min_samples_leaf’: 4, ‘n_estimators’: 50}
from sklearn.pipeline import make_pipeline
from sklearn.preprocessing import MinMaxScaler
model = make_pipeline(
    MinMaxScaler(),
    RandomForestClassifier(max_depth=7, min_samples_leaf=4, n_estimators=50)
)
model.fit(train_X, train_y)
y_pred = model.predict(pred_X)
model.score(test_X, test_y)
0.7728215767634855
y_pred = model.predict(pred_X)
uuid = (i+1 for i in np.arange(4000))
label = y_pred.astype(int)
pred_df = pd.DataFrame({
    'uuid': uuid,
    'label': y_pred
})
# 保存结果
pred_df.to_csv('E:/DocumentFile/data/糖尿病遗传风险预测挑战赛公开数据/预测结果.csv', index=False)
第一次参加数据挖掘竞赛的成绩并不理想,每一步都在摸索中,我认为在处理‘胰岛素释放实验’及‘肱三头肌皮褶厚度’时有所不妥,对这种超半数的异常值处理没有找到好的方法。并且在构建模型时,没有更多层的模型嵌套及优化。Continue...

