Python绘制折线图or平滑曲线图(2D)
一、折线图
Python使用matplotlib进行2D绘图的主要思想就是传入x坐标数组和y坐标数组,然后调用plot函数。其中x数组的长度和y坐标数组的长度要必须一致。只要二者的数据有了,那么画一个折线图就是非常简单的事情。例如
代码
import numpy as np
import matplotlib.pyplot as plt

# plot double lines
def plot_double_lines(n, x, y1, y2, pic_name):
    # initialize plot parameters
    print('picture name: %s, len of data: %d' % (pic_name, n))
    plt.rcParams['figure.figsize'] = (10 * 16 / 9, 10)
    plt.subplots_adjust(left=0.06, right=0.94, top=0.92, bottom=0.08)

    # plot curve 1
    plt.plot(x, y1, label='Score')

    # plot curve 2
    plt.plot(x, y2, label='Similarity')

    # show the legend
    plt.legend()

    # show the picture
    plt.show()


if __name__ == '__main__':
    xs = np.array([1, 2, 3, 4, 5, 6, 7, 8])
    y1s = np.array([8.0, 6.0, 5.7, 5.6, 5.2, 1.0, 0.8, 0.6])
    y2s = np.array([0.9, 0.8, 0.75, 0.41, 0.03, 0.01, 0.0, 1.0])
    plot_double_lines(len(xs), xs, y1s, y2s, 'Two Curves')
效果
二、平滑曲线图
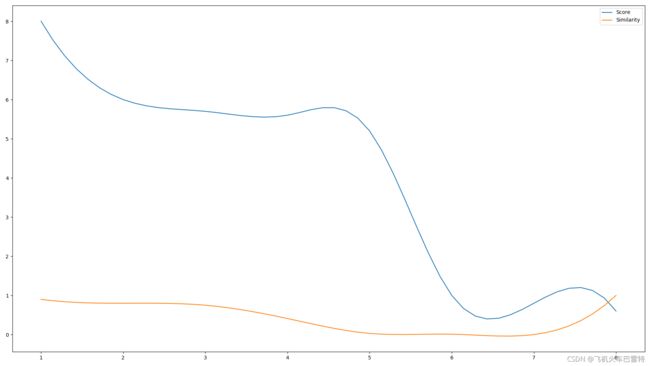
有时候我们希望得到的图曲线更加平滑一些,而不是一个折线图。这样的话,就需要对x坐标数组和y坐标数组进行插值了。虽然这毫无疑问会得到一个比较平滑的曲线图,但如果放大来看,它实际上还是折线图,只不过是由于折线图中折起来的那部分肉眼基本上看不到(导致看起来是平滑的)而已。基于这样的思想,我们借助scipy.interpolate中的插值方法,来对x坐标数组和y坐标数组进行插值,以实现我们的目的。
代码
import numpy as np
import matplotlib.pyplot as plt
from scipy.interpolate import make_interp_spline


# plot double lines
def plot_double_lines(n, x, y1, y2, pic_name):
    # initialize plot parameters
    print('picture name: %s, len of data: %d' % (pic_name, n))
    plt.rcParams['figure.figsize'] = (10 * 16 / 9, 10)
    plt.subplots_adjust(left=0.06, right=0.94, top=0.92, bottom=0.08)

    # 对x和y1进行插值
    x_smooth = np.linspace(x.min(), x.max(), 50)
    y1_smooth = make_interp_spline(x, y1)(x_smooth)
    # plot curve 1
    plt.plot(x_smooth, y1_smooth, label='Score')

    # 对x和y2进行插值
    x_smooth = np.linspace(x.min(), x.max(), 50)
    y2_smooth = make_interp_spline(x, y2)(x_smooth)
    # plot curve 2
    plt.plot(x_smooth, y2_smooth, label='Similarity')

    # show the legend
    plt.legend()

    # show the picture
    plt.show()


if __name__ == '__main__':
    xs = np.array([1, 2, 3, 4, 5, 6, 7, 8])
    y1s = np.array([8.0, 6.0, 5.7, 5.6, 5.2, 1.0, 0.8, 0.6])
    y2s = np.array([0.9, 0.8, 0.75, 0.41, 0.03, 0.01, 0.0, 1.0])
    plot_double_lines(len(xs), xs, y1s, y2s, 'Visualization of Linking Prediction')
效果

