python scipy.optimize least_squares实现最小二乘法
Least-squares minimization (least_squares)
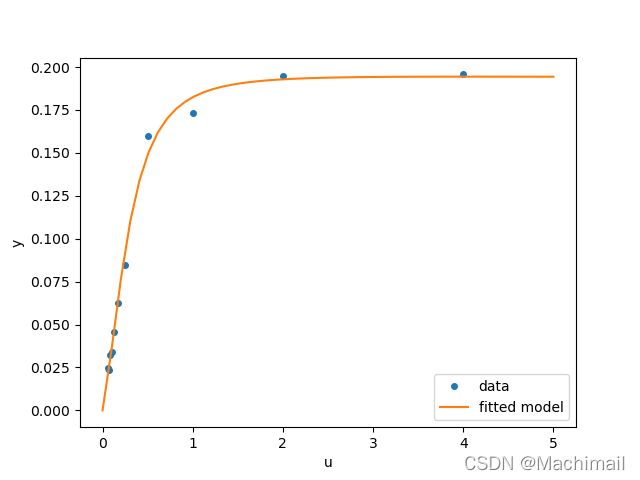
The code below implements least-squares estimation of and finally plots the original data and the fitted model function:X
scipy.optimize.least_squares(fun, x0, jac=‘2-point’, bounds=(- inf, inf), method=‘trf’, ftol=1e-08, xtol=1e-08, gtol=1e-08, x_scale=1.0, loss=‘linear’, f_scale=1.0, diff_step=None, tr_solver=None, tr_options={}, jac_sparsity=None, max_nfev=None, verbose=0, args=(), kwargs={})
# -*- coding: utf-8 -*-
"""
Created on Sat Dec  4 22:43:05 2021

@author: Machi
"""

from scipy.optimize import least_squares
import numpy as np
import matplotlib.pyplot as plt

def model(x, u):
    return x[0] * (u ** 2 + x[1] * u) / (u ** 2 + x[2] * u + x[3])

def fun(x, u, y):
    return model(x, u) - y

def jac(x, u, y):
    J = np.empty((u.size, x.size))
    den = u ** 2 + x[2] * u + x[3]
    num = u ** 2 + x[1] * u
    J[:, 0] = num / den
    J[:, 1] = x[0] * u / den
    J[:, 2] = -x[0] * num * u / den ** 2
    J[:, 3] = -x[0] * num / den ** 2
    return J

u = np.array([4.0, 2.0, 1.0, 5.0e-1, 2.5e-1, 1.67e-1, 1.25e-1, 1.0e-1,
              8.33e-2, 7.14e-2, 6.25e-2])
y = np.array([1.957e-1, 1.947e-1, 1.735e-1, 1.6e-1, 8.44e-2, 6.27e-2,
              4.56e-2, 3.42e-2, 3.23e-2, 2.35e-2, 2.46e-2])
x0 = np.array([2.5, 3.9, 4.15, 3.9])

res = least_squares(fun, x0, jac=jac, bounds=(0, 100), args=(u, y), verbose=1)

res.x


u_test = np.linspace(0, 5)
y_test = model(res.x, u_test)
plt.plot(u, y, 'o', markersize=4, label='data')
plt.plot(u_test, y_test, label='fitted model')
plt.xlabel("u")
plt.ylabel("y")
plt.legend(loc='lower right')
plt.show()
