基于传统几何方法的十字路口检测
复现导师发我的一篇毕业论文的后半部分。其实是挺过时的东西了,不过貌似做的人很少,复现出来结果也不错,挺有想法的一篇文章。
论文题目:《基于航拍图像的目标检测系统设计与实现》
Github:传送门
系统总流程

大致流程是将红外图像预处理,包括灰度化、直方图均衡化、开闭运算、边缘提取。然后利用霍夫变换直线检测,根据直线的交点和相交角度来初步定位十字路口,其中用到了交点的聚类和mean-shift开窗迭代找重心。最后一步是十字路口的二次判定,也是文章的精华,利用改进的CCDC方法,统计矩形簇上的像素点,根据这些点的统计特征来判定。
实际复现时,对此程序做了些简化修改,效果更好。
图像预处理
读入图片、灰度化、直方图均衡化、二值化
import cv2
import numpy as np
from scipy.cluster.hierarchy import dendrogram, linkage, fcluster
from matplotlib import pyplot as plt
img = cv2.imread("1.jpg", 1)
gray = cv2.cvtColor(img, cv2.COLOR_BGR2GRAY)
dst = cv2.equalizeHist(gray)
ret, img_thresh = cv2.threshold(dst, 203, 255, cv2.THRESH_BINARY )
#cv2.imwrite("img_thresh.jpg",img_thresh)
开操作-先腐蚀后膨胀
这里是为了去除航拍图像中间的光标,并使道路边缘更平滑。
Matrix = np.ones((3, 3), np.uint8)
img_edge1 = cv2.erode(img_thresh, Matrix)
#cv2.imshow('erode.jpg',img_edge1 )
Matrix2 = np.ones((7, 7), np.uint8)
img_edge2 = cv2.dilate(img_edge1, Matrix2)
#cv2.imwrite('dilate.jpg',img_edge2)
Hough变换
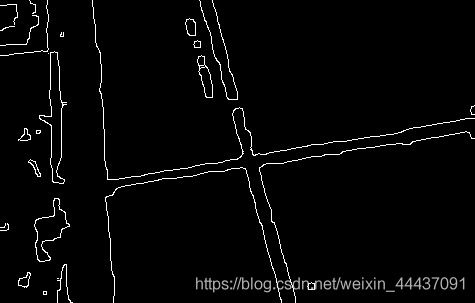
Canny边缘检测
edges = cv2.Canny(img_edge2,100,200,apertureSize = 7)
#cv2.imwrite('edges.jpg',edges)
Hough直线检测
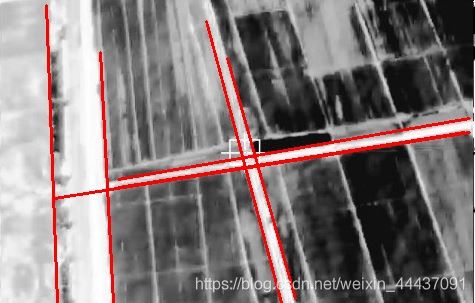
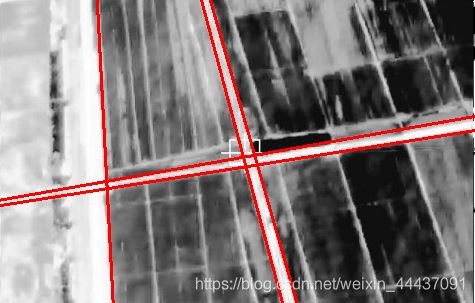
这里做了一些修改,原文中所做的检测是检测直线上的点,最后记录线段,然后再根据线段扩充成直线求交点。个人觉得这样是无意义的,故直接采用直线检测。
"""
#作者的方法
lines = cv2.HoughLinesP(edges,1,np.pi/180,80,minLineLength=70,maxLineGap=80)
lines1 = lines[:,0,:]#提取为二维
print(len(lines1))
for x1,y1,x2,y2 in lines1[:]:
    cv2.line(img,(x1,y1),(x2,y2),(0,0,255),2)
    #cv2.line(edges,(x1,y1),(x2,y2),(0,255,0),2)

cv2.imwrite('line1.jpg',img)
#cv2.imshow('line2.jpg',edges)
"""
#复现的方法
lines = cv2.HoughLines(edges,1,np.pi/180,100)
lines2 = lines[:,0,:]#提取为为二维
print(len(lines2))
lines1=[]
for rho,theta in lines2[:]:
    a = np.cos(theta)
    b = np.sin(theta)
    x0 = a*rho
    y0 = b*rho
    x1 = int(x0 + 1000*(-b))
    y1 = int(y0 + 1000*(a))
    x2 = int(x0 - 1000*(-b))
    y2 = int(y0 - 1000*(a))
    lines1.append([x1,y1,x2,y2])
    #cv2.line(img,(x1,y1),(x2,y2),(0,0,255),2)
#cv2.imwrite('line2.jpg',img)
求交点
简单的两直线相交求交点,并单独考虑了斜率不存在的情况。
def cross_point(line1, line2):  # 计算交点函数
    #是否存在交点
    point_is_exist=False
    x=0
    y=0
    x1 = line1[0]  # 取四点坐标
    y1 = line1[1]
    x2 = line1[2]
    y2 = line1[3]

    x3 = line2[0]
    y3 = line2[1]
    x4 = line2[2]
    y4 = line2[3]

    if (x2 - x1) == 0:
        k1 = None
    else:
        k1 = (y2 - y1) * 1.0 / (x2 - x1)  # 计算k1,由于点均为整数,需要进行浮点数转化
        b1 = y1 * 1.0 - x1 * k1 * 1.0  # 整型转浮点型是关键

    if (x4 - x3) == 0:  # L2直线斜率不存在操作
        k2 = None
        b2 = 0
    else:
        k2 = (y4 - y3) * 1.0 / (x4 - x3)  # 斜率存在操作
        b2 = y3 * 1.0 - x3 * k2 * 1.0

    if k1 is None:
        if not k2 is None:
            x = x1
            y = k2 * x1 + b2
            #point_is_exist=True
    elif k2 is None:
        x=x3
        y=k1*x3+b1
    elif not k2==k1:
        x = (b2 - b1) * 1.0 / (k1 - k2)
        y = k1 * x * 1.0 + b1 * 1.0
    if (x>0)&(y>0) :
        point_is_exist=True
    return point_is_exist,[x, y]
points=[]
i=0
while i<len(lines1):
    a=lines1[i]
    #print(a)
    i=i+1
    j=i
    while j<len(lines1):
        b=lines1[j]
        j=j+1

        point_is_exist, [x, y]=cross_point(a,b)
        if point_is_exist:
                print([x,y])
                points.append([x,y])
                #cv2.circle(img,(int(x),int(y)),5,(255,0,0),2)

print(len(points))
#cv2.imwrite('points.jpg', img)
交点聚类
原文中采用层次聚类,并利用均值漂移算法计算重心。实际使用时,重心常常陷入局部最优,找不到十字路口。故这里直接采用聚类后点的几何中心,效果明显优于文中。
def hierarchy_cluster(data,threshold, method='average'):
    '''层次聚类

    Arguments:
        data [[0, float, ...], [float, 0, ...]] -- 文档 i 和文档 j 的距离

    Keyword Arguments:
        method {str} -- [linkage的方式: single、complete、average、centroid、median、ward] (default: {'average'})
        threshold {float} -- 聚类簇之间的距离
    Return:
        cluster_number int -- 聚类个数
        cluster [[idx1, idx2,..], [idx3]] -- 每一类下的索引
    '''
    data = np.array(data)

    Z = linkage(data, method='average')
    cluster_assignments = fcluster(Z, threshold, criterion='distance')
    #print type(cluster_assignments)
    num_clusters = cluster_assignments.max()
    indices = get_cluster_indices(cluster_assignments)

    return num_clusters, indices


def get_cluster_indices(cluster_assignments):
    '''映射每一类至原数据索引

    Arguments:
        cluster_assignments 层次聚类后的结果

    Returns:
        [[idx1, idx2,..], [idx3]] -- 每一类下的索引
    '''
    n = cluster_assignments.max()
    indices = []
    for cluster_number in range(1, n + 1):
        indices.append(np.where(cluster_assignments == cluster_number)[0])

    return indices
arr = np.array(points)

num_clusters, indices = hierarchy_cluster(arr,30)


print ("%d clusters" % num_clusters)
ave=[]
for k, ind in enumerate(indices):

    sumx=0
    sumy=0
    n=0
    print ("cluster", k + 1, "is", ind)
    if len(ind)>2:
        for i in ind:

            print(points[i])
            x,y=points[i]
            sumx=sumx+x
            sumy=sumy+y
            n=n+1
        ave.append([sumx/n,sumy/n])
print ('center point is',ave)
形状判别

CCDC方法:
(1) 计算所有离散点坐标,创建 CCDC(或读取已经保存的数据);
(2) 读取图形,确定的质心位置,计算图形的最大半径;
(3) 将图形映射到 CCDC;
(4) 利用特征函数提取单个圆环的弧特征;
(5) 将所有圆环特征组成特征向量得到形状的 CCDC 特征。
这里使用的是矩形簇而非圆簇: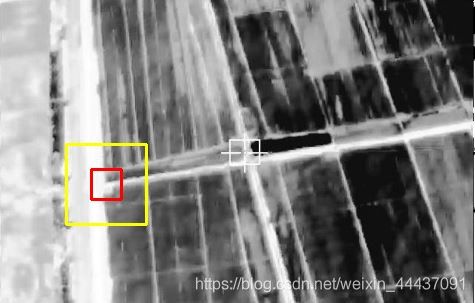

如图,聚类后,交点大致分为两簇,分别对两簇统计矩形簇。红色代表最内层、黄色最外层。

如图,与十字路口相交的记为形状弧段。显然每一圈上的形状弧段应为4且长度大致相等。于是可以统计四段形状弧段的圈数所占比例,以及弧段长度的方差来判定是不是十字路口。
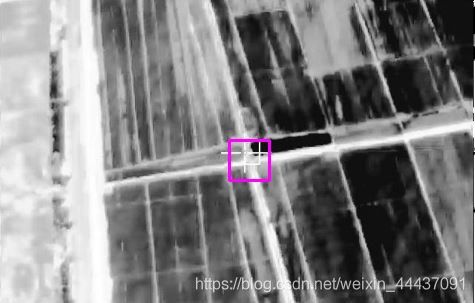
最终效果:
# 论文中的其他图片:

绿框是文中结果,紫框是复现结果。
完整代码下载:code


