【机器学习 - 4】:线性回归算法
文章目录
- 线性回归
-
- 线性回归的理解
- 损失函数
- 简单线性回归
-
- 封装线性回归算法
- 线性回归算法
-
- 在sklearn中调用线性回归算法
- 向量化运算
- 线性回归模型中的误差
-
- 均方误差 MSE
- 均方根误差
- 平均绝对误差
- 调用sklearn中的均方根误差和平均绝对误差函数
- R squared error (常用)
线性回归
线性回归的理解
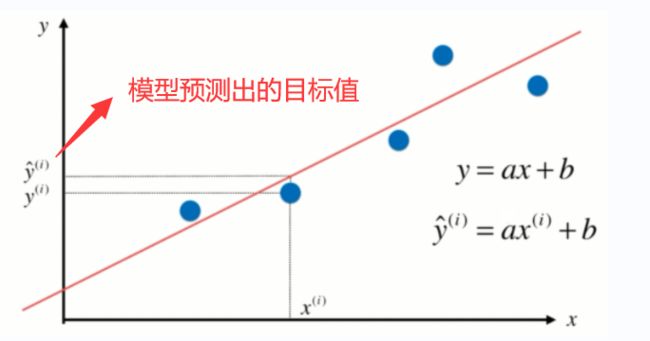
线性回归:判断数据的特征和目标值之间具有一定的线性关系。
简单线性回归:样本的特征只有一个,用线性回归法进行预测,叫做简单线性回归。
多元线性回归:样本的特征有两个或两个以上,叫做多元线性回归。
损失函数
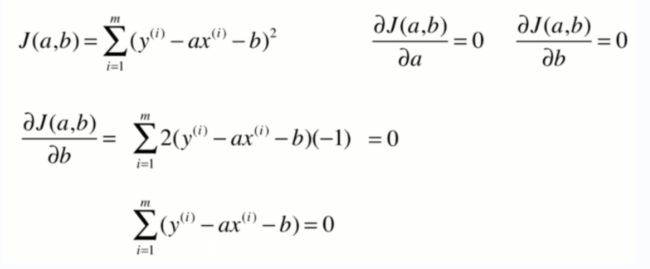
损失函数:np.sum((y`-y)**2),即预测值和真实值的差值之和。因为有复数的存在所以求平方,不用绝对值的原因:用平方方便后续的求导和求极值。
简单线性回归
- 先画出数据的散点图
import numpy as np
import matplotlib.pyplot as plt

x = np.array([1,2,3,4,5])
y = np.array([2,1,3,2,5])

plt.scatter(x,y)
plt.axis([0,6,0,6])
plt.show()
- 对数据进行处理,求出a和b
# y = a * x + b
# 先求出平均值
x_mean = np.mean(x)
y_mean = np.mean(y)

num = 0.0 # 分子
d = 0.0 # 分母

for x_i, y_i in zip(x, y):
    num += (x_i-x_mean)*(y_i-y_mean)
    d += (x_i-x_mean)**2
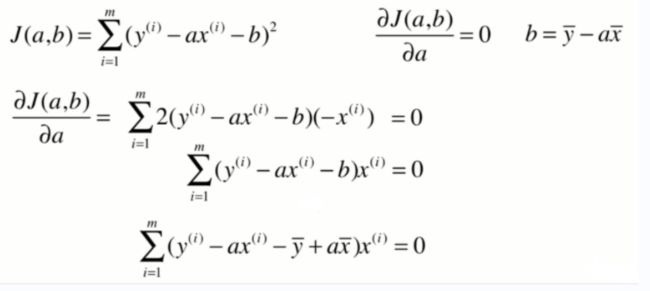
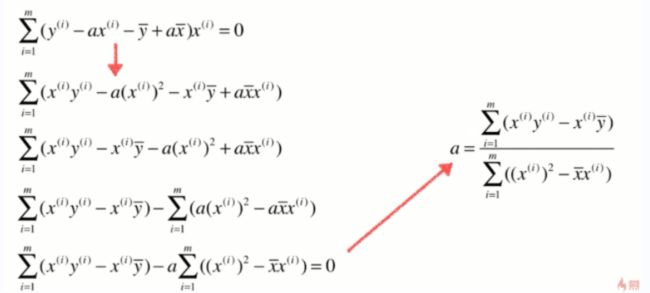
a = num/d
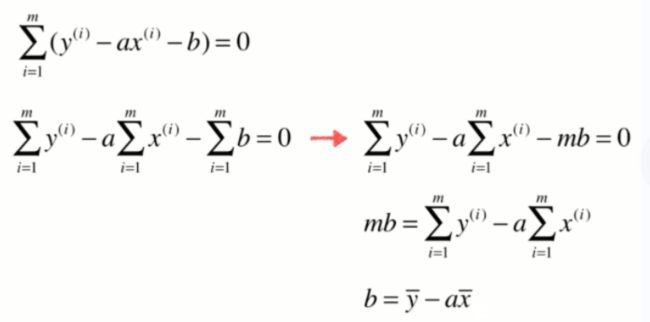
b = y_mean-a*x_mean
- 求出y`,并画出预测直线,求出这条线,使得真实值与预测值的差值达到最小。
y_hat = a * x + b

plt.plot(x, y_hat, color='r')
plt.scatter(x,y)
plt.axis([0, 6, 0, 6])
plt.show()
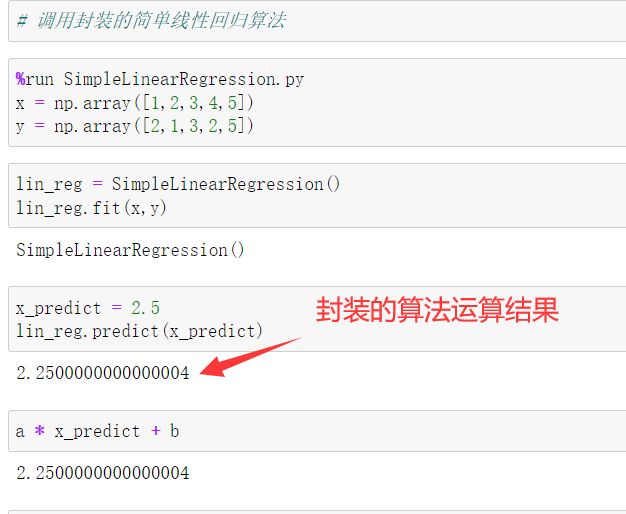
封装线性回归算法
import numpy as np


class SimpleLinearRegression:
    def __init__(self):
        self.a_ = None
        self.b_ = None
        self.x_mean = None
        self.y_mean = None

    def fit(self, x_train, y_train):
        self.x_mean = np.mean(x_train)
        self.y_mean = np.mean(y_train)

        num = 0.0   # 分子
        d = 0.0     # 分母
        for x_i, y_i in zip(x_train, y_train):
            num += (x_i-self.x_mean) * (y_i-self.y_mean)
            d += (x_i-self.x_mean)**2
        self.a = num/d
        self.b = self.y_mean - self.a * self.x_mean

        return self

    def predict(self, x_test):
        return self.a * x_test + self.b

    def __repr__(self):
        return 'SimpleLinearRegression()'
线性回归算法
使用线性回归算法的前提:数据具有一定的线性关系。
我们希望找到一条最佳拟合的直线方程,y=ax+b,对于每一个样本点,在这个直线方程上都有一个预测值,预测值和真实值有一定的差距,我们希望这些样本到直线方程的差距之和最小。
计算差距:sqrt(|y-y`|**2),使用平方并开根号的方式更适合我们进行求导或求值。
在sklearn中调用线性回归算法
- 导入模块
from sklearn.linear_model import LinearRegression
import numpy as np
import matplotlib.pyplot as plt
- 准备数据,训练模型
# 准备数据
x = np.array([1,2,3,4,5])
y = np.array([3,1,4,3,6])

lin_reg = LinearRegression()
lin_reg.fit(x.reshape(-1,1), y)	# 拟合,训练模型
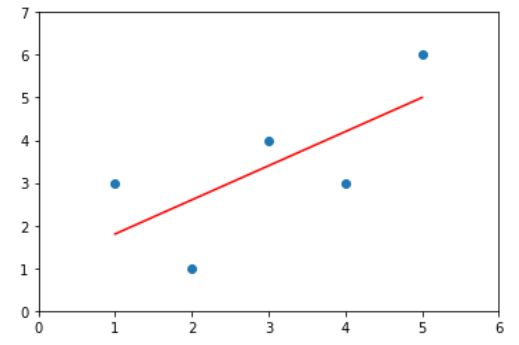
- 画出散点图和预测直线
plt.scatter(x, y)
plt.plot(x, lin_reg.predict(x.reshape(-1,1)), color='r')
plt.axis([0,6,0,7])
plt.show()
向量化运算
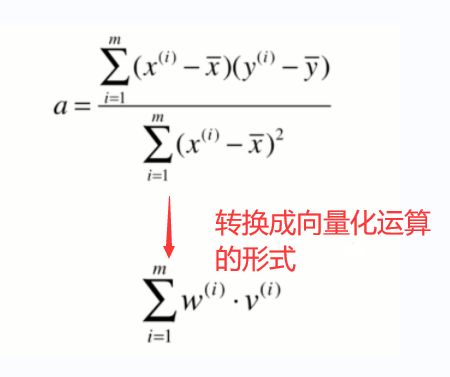
如下图所示,向量化运算更加方便,向量点乘是先乘后加,原理一样。
x = np.array([1,2,3,4,5])
y = np.array([3,1,4,3,6])
def lin_fit(x, y):
    x_mean = np.mean(x)
    y_mean = np.mean(y)
    num = 0.0
    d = 0.0
    num = (x-x_mean).dot(y-y_mean)
    d = (x-x_mean).dot(x-x_mean)
    a = num/d
    b = y_mean-a*x_mean
    return a, b
线性回归模型中的误差
在分类问题可以将score看成准确率,在回归问题将score看成模型的好坏程度。

均方误差 MSE
均方误差的公式如下图所示:
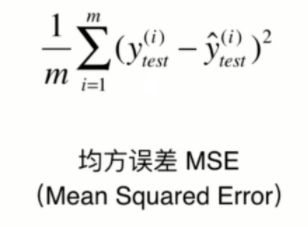
为什么要除以样本数量m?
举个例子,比如第一个团队有2个人,统计其工资的均方误差为800,第二个团队有100个人,工资的均方误差为1000,能说明第一个团队比较好吗?这是不行的,因为统计的个数不同,样本不同,导致量纲不一样,所以需要除以样本数量m,减少量纲的影响。
封装的函数
# 均方误差 MSE
def MSE(y_true, y_predict):
    return np.sum((y_true-y_predict)**2)/len(y_true)
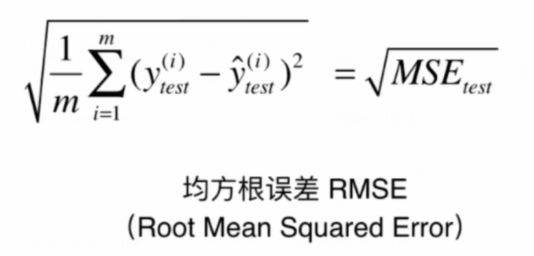
均方根误差
封装的均方根误差
# 均方根误差
from math import sqrt
def RMSE(y_true, y_predict):
    return sqrt(np.sum((y_true-y_predict)**2)/len(y_true))
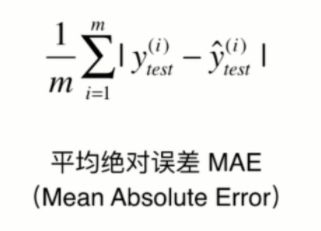
平均绝对误差
# 平均绝对误差
def MAE(y_true, y_predict):
    return np.sum(np.absolute(y_true-y_predict))/len(y_true)
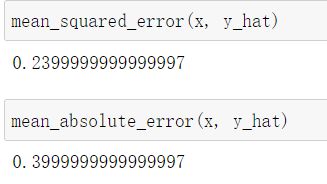
调用sklearn中的均方根误差和平均绝对误差函数
from sklearn.metrics import mean_squared_error, mean_absolute_error
mean_squared_error(x, y_hat)
mean_absolute_error(x, y_hat)
R squared error (常用)
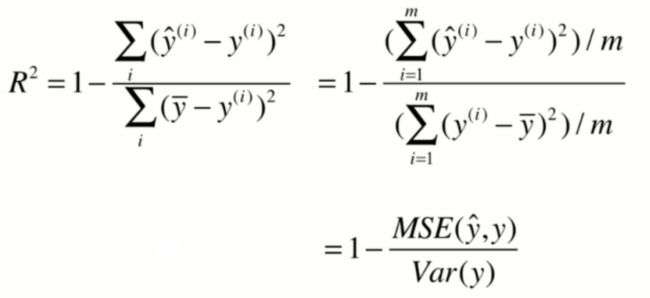
R^2(以下用R2表示)分类的准确度在0和1之间,R2为1时,模型最优,即没有出现任何错误。
import numpy as np
x = np.array([1,2,3,4,5])
y = np.array([3,1,4,3,6])
def r2_score(x_true, y_predict):
    return 1-((np.sum((x_true-y_predict)**2)/len(x_true))/np.var(x_true))
或调用均值方差 MSE

调用sklearn中的线性回归算法,计算预测值,最终的误差结果还是一样
from sklearn.linear_model import LinearRegression
lin_reg = LinearRegression()
lin_reg.fit(x.reshape(-1,1), y)
y_predict = lin_reg.predict(x.reshape(-1,1))
