python数据清洗+数据可视化
开发环境介绍
-
anaconda
- 集成环境:集成好了数据分析和机器学习所需要的全部环境
- 注意:安装目录中不可以有中文和特殊符号 -
jupyter
- jupyter就是anaconda提供的一个基于浏览器的可视化开发工具
-
jupyter基本使用
-
启动:在终端录入:jupyter notebook的指令,按下回车
-
新建:
-
python3: anaconda中的一个源文件
-
cell有两个模式:code 和 markdown; 修改模式:m ,y(修改成code模式)
-
添加cell: a|b
-
删除cell: x
-
执行cell: shift+enter
-
tab: 自动补全
- 打开帮助文档:shift+tab
-
-
数组和列表的区别是什么?
- 数组中存储的元素类型必须是同一类型
- 优先级:
- 字符串>浮点型>整数
使用Python对csv文件操作
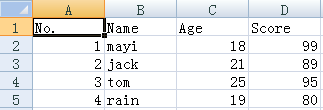
csv是Comma-Separated Values的缩写,是用文本文件形式储存的表格数据,比如如下的表格:
注意从csv读出的都是str类型。
pandas
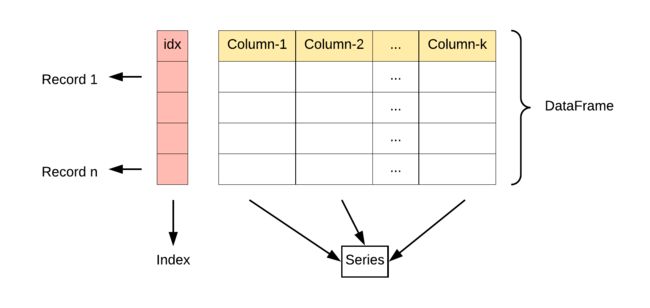
Pandas 的主要数据结构是 Series (一维数据)与 DataFrame(二维数据)。
- Series 是一种类似于一维数组的对象,它由一组数据(各种Numpy数据类型)以及一组与之相关的数据标签(即索引)组成。
- DataFrame 是一个表格型的数据结构,它含有一组有序的列,每列可以是不同的值类型(数值、字符串、布尔型值)。DataFrame 既有行索引也有列索引,它可以被看做由 Series 组成的字典(共同用一个索引)。
Pandas 数据结构 - Series
Pandas Series 类似表格中的一个列(column),类似于一维数组,可以保存任何数据类型。
Series 由索引(index)和列组成,函数如下:
pandas.Series( data, index, dtype, name, copy)
参数说明:
- data:一组数据(ndarray 类型)。
- index:数据索引标签,如果不指定,默认从 0 开始。
- dtype:数据类型,默认会自己判断。
- name:设置名称。
- copy:拷贝数据,默认为 False。
import pandas as pd
a=[1,2,1,43]
myvarr=pd.Series(a)
print(myvarr)
#print(myvarr[1])
输出结果如下:

指定索引值
# 第一种方法
myvar = pd.Series(a, index = ["x", "y", "z"])

#第二种方法
sites = {1: "Google", 2: "Runoob", 3: "Wiki"}
myvar=pd.Series(sites)
Pandas 数据结构 - DataFrame
DataFrame 是一个表格型的数据结构,它含有一组有序的列**,每列可以是不同的值类型(数值、字符串、布尔型值)**。DataFrame 既有行索引也有列索引,它可以被看做由 Series 组成的字典(共同用一个索引)。
DataFrame 构造方法如下:
pandas.DataFrame( data, index, columns, dtype, copy)
参数说明:
- data:一组数据(ndarray、series, map, lists, dict 等类型)。
- index:索引值,或者可以称为行标签。
- columns:列标签,默认为 RangeIndex (0, 1, 2, …, n) 。
- dtype:数据类型。
- copy:拷贝数据,默认为 False。
#使用列表创建
import pandas as pd
data = [['Google',10],['Runoob',12],['Wiki',13]]
df = pd.DataFrame(data,columns=['Site','Age'],dtype=float)
print(df)
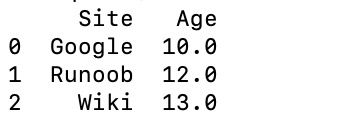
输出结果如下:
以下实例使用 ndarrays 创建,ndarray 的长度必须相同, 如果传递了 index,则索引的长度应等于数组的长度。如果没有传递索引,则默认情况下,索引将是range(n),其中n是数组长度。
#使用 ndarrays 创建
import pandas as pd
data = {'Site':['Google', 'Runoob', 'Wiki'], 'Age':[10, 12, 13]}
df = pd.DataFrame(data)
#df = pd.DataFrame(data, index = ["day1", "day2", "day3"])
print (df)
输出结果如下:
从以上输出结果可以知道, DataFrame 数据类型一个表格,包含 rows(行) 和 columns(列):
#使用字典创建
import pandas as pd
data = [{'a': 1, 'b': 2},{'a': 5, 'b': 10, 'c': 20}]
df = pd.DataFrame(data)
print (df)

输出结果为:
   a   b     c
0  1   2   NaN
1  5  10  20.0
python按行或列读取csv文件的方式
https://blog.csdn.net/qq_41814556/article/details/82694116
方式一:生成字典形式
使用DictReader逐行读取csv文件
返回的每一个单元格都放在一个字典的值内,而这个字典的键则是这个单元格的列标题
# 逐行读取csv文件
with open(filename,'r',encoding="utf-8") as csvfile:
    reader = csv.DictReader(csvfile)
    for row in reader:
        if row['media_name']=='hello':
            print(row)
            lines.append(row)
方式二:逐行读取
使用Reader逐行读取CSV文件,Reader为一个阅读器
我们调用csv.reader(),并将前面存储的文件对象作为实参传递给它,从而创建一个与该文件相关联的阅读亲返回一个(reader)对象,就可以从其中解析出csv的内容,以行为单位
import csv
with open('file.csv','r',encoding=“utf-8”) as csvfile:
    reader = csv.reader(csvfile)
    rows = [row for row in reader]
注意:参数“r”,为读取状态,若为“rb”,则表示读取二进制文件;若为“rt”,则为读取文本模式
方式三:读取某一列
with open(filename,encoding="utf-8") as f:
    reader = csv.reader(f)
    header_row = next(reader)
    datas = []
    for row in reader:
        print(row[2])
方式四:获取每个元素的索引及其值
with open(filename,encoding="utf-8") as f:
    reader = csv.reader(f)
    header_row = next(reader)
    for index,column_header in enumerate(header_row):
        print(index,column_header)
pandas读取指定行/列的几种操作
https://blog.csdn.net/bianxia123456/article/details/111396760
一、读取整个文件之后进行切片处理
读取文件:
import pandas as pd
df = pd.read_csv("路径\文件名称")
读取之后取出特定行、列:
# 第1行
print(df.iloc[0])
# 前3行
print(df.iloc[:3])
# 第1列
print(df.iloc[:, 0])
# 前2列
print(df.iloc[:, :2])

### [行 :列]   [0:5 , 0:5]

#第四行到第十行
df[3:10]
#直接看某一列的值
df["列的名字"]
二、不读取整个文件,读取特定的行与列
有时候遇见文件太大,我们直接读取所需要的的指定的行与列
读取行操作
import pandas as pd
#只读取前十五行
df = pd.read_csv("路径\文件名称",nrows = 15)
#读取第十行到第十五行
#pd.read_csv(路径,skiprows=需要忽略的行数,nrows=你想要读的行数)
pd.read_csv("路径\文件名称",skiprows=9,nrows=5),忽略前9行,往下读5行
读取列操作
import pandas as pd
#只读第一列,想读哪一列就在后面写哪一列
df = pd.read_csv("1217_1out.csv",usecols=[0])
pandas 获取Dataframe元素值的几种方法
https://blog.csdn.net/sinat_29675423/article/details/87975489
选择列
使用类字典属性,返回的是Series类型 : data[‘w’],遍历Series
    for index in data['w'] .index:
        time_dis = data['w'] .get(index)
pandas.DataFrame.at
根据行索引和列名,获取一个元素的值:
>>> df = pd.DataFrame([[0, 2, 3], [0, 4, 1], [10, 20, 30]],
...                   columns=['A', 'B', 'C'])
>>> df
    A   B   C
0   0   2   3
1   0   4   1
2  10  20  30

>>> df.at[4, 'B']
2
或
>>> df.iloc[5].at['B']
4
pandas.DataFrame.iat
根据行索引和列索引获取元素值
>>> df.iat[1, 2]
1
或
>>> df.iloc[0].iat[1]
2
pandas.DataFrame.loc
>>> df = pd.DataFrame([[1, 2], [4, 5], [7, 8]],
...      index=['cobra', 'viper', 'sidewinder'],
...      columns=['max_speed', 'shield'])
>>> df
            max_speed  shield
cobra               1       2
viper               4       5
sidewinder          7       8

选取元素:
>>> df.loc['cobra', 'shield']
2

选取行返回一个series:
>>> df.loc['viper']
max_speed    4
shield       5
Name: viper, dtype: int64

 取行列返回dataframe:
  >>> df.loc[['viper', 'sidewinder']]
            max_speed  shield
viper               4       5
sidewinder          7       8
pandas.DataFrame.iloc
>>> mydict = [{'a': 1, 'b': 2, 'c': 3, 'd': 4},
...           {'a': 100, 'b': 200, 'c': 300, 'd': 400},
...           {'a': 1000, 'b': 2000, 'c': 3000, 'd': 4000 }]
>>> df = pd.DataFrame(mydict)
>>> df
      a     b     c     d
0     1     2     3     4
1   100   200   300   400
2  1000  2000  3000  4000


按索引选取元素:
  >>> df.iloc[0, 1]
2

获取行的series:
>>> type(df.iloc[0])
<class 'pandas.core.series.Series'>
>>> df.iloc[0]
a    1
b    2
c    3
d    4
Name: 0, dtype: int64
$$$ 将几个csv文件合为一个csv文件
csv_name_list=['1_100.csv','101_200.csv', '201_300.csv', '301_400.csv', '401_500.csv', '501_600.csv', '601_700.csv', '700_719.csv']
length=len(csv_name_list)
# 读取第一个CSV文件并包含表头,用于后续的csv文件拼接
f=open('component:Blink>JavaScript status:Fixed Type=Bug-Regression_2021_11_6/1_100.csv',encoding='utf-8')
df=pd.read_csv(f)
df.to_csv('all_csv',index=False)
f.close()

for i in range(1,length):
    filename='component:Blink>JavaScript status:Fixed Type=Bug-Regression_2021_11_6/'+csv_name_list[i]
    f=open(filename,encoding='utf-8')
    df=pd.read_csv(f)
    df.to_csv('all_csv',index=False, header=False, mode='a+')
    f.close()
对名字为1_100,101_200等的文件进行合并的操作
import pandas as pd
import os

csv_name_list=[]
def file_name_listdir(file_dir):
    for files in os.listdir(file_dir):  # 不仅仅是文件,当前目录下的文件夹也会被认为遍历到
        csv_name_list.append(files)

file_name_listdir("/home/wangyue/PycharmProjects/pachong/V8_CODE_MAC/status:Fixed_Type=Bug_2021_11_6")
print(csv_name_list)

dict={}

for name in csv_name_list:
    name_temp=name.split('_',1) #把1_100.csv进行划分成两部分,[1,100.csv]
    temp=name_temp[0] # 取列表中的第一个转化为数字进行排序,和1_100.csv名字,作为键值对进行存储
    print(type(temp))
    t=int(temp)
    print(type(t))
    dict[t]=name

csv_name_list_sorted=[]
for i in sorted(dict.keys()): #对字典的键进行排序,得到值的列表
    csv_name_list_sorted.append(dict[i])

print(csv_name_list_sorted)

length=len(csv_name_list_sorted)
# 读取第一个CSV文件并包含表头,用于后续的csv文件拼接
f=open('status:Fixed_Type=Bug_2021_11_6/1_100.csv',encoding='utf-8')
df=pd.read_csv(f)
df.to_csv('status:Fixed_Type=Bug_2021_11_6/all_csv',index=False)
f.close()

for i in range(1,length):
    filename='status:Fixed_Type=Bug_2021_11_6/'+csv_name_list_sorted[i]
    f=open(filename,encoding='utf-8')
    df=pd.read_csv(f)
    df.to_csv('status:Fixed_Type=Bug_2021_11_6/all_csv',index=False, header=False, mode='a+')
    f.close()
Matplotlib教程
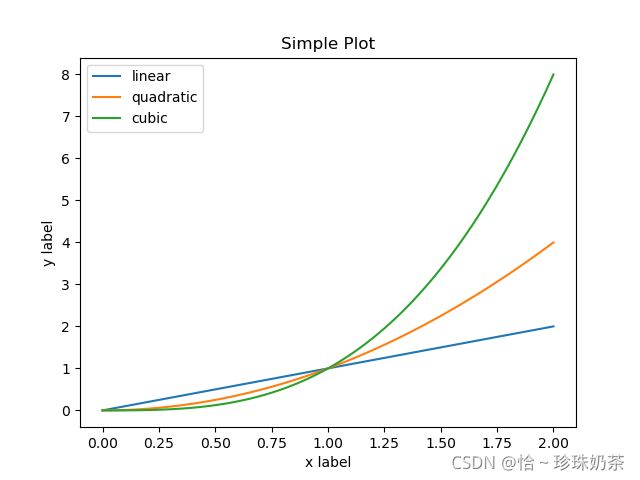
import matplotlib.pyplot as plt
import numpy as np

x = np.linspace(0, 2, 100) #0-2,分成10个单位

plt.figure()
plt.plot(x, x, label='linear')  # Plot some data on the (implicit) axes.
plt.plot(x, x**2, label='quadratic')  #   plot(x,y,这条线的名称)
plt.plot(x, x**3, label='cubic')
plt.xlabel('x label')
plt.ylabel('y label')
plt.title("Simple Plot")
plt.legend()
#plt.show() 显示图
print(plt.show())

#----------------定义了一个figure,下面的都是与这个firgue有关的
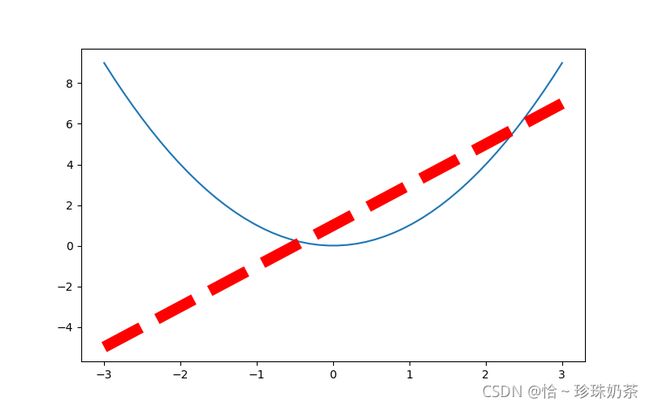
plt.figure(num=3,figsize=(8,5)) #num序号为3
x=np.linspace(-3,3,50)
y1=2*x+1
y2=x**2
plt.plot(x,y2)
#plt.plot(x,y1,color='red',linewidth=1,linestyle='--')
plt.plot(x,y1,color='red',linewidth=10,linestyle='--')
print(plt.show())
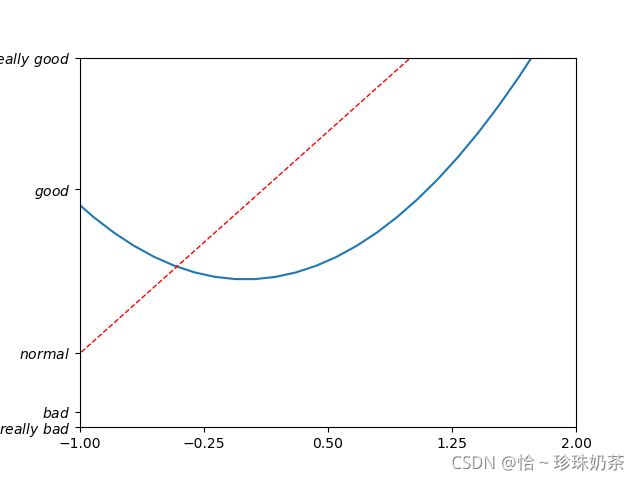
plt.figure()
#set x limits
plt.xlim((-1, 2))
plt.ylim((-2, 3))

# set new sticks
new_sticks = np.linspace(-1, 2, 5)
plt.xticks(new_sticks)
# set tick labels
plt.yticks([-2, -1.8, -1, 1.22, 3],
           [r'$really\ bad$', r'$bad$', r'$normal$', r'$good$', r'$really\ good$']) #空格需要添加转义字符‘\’ ,r表示正则表达式,'$....$'读这段的内容
plt.plot(x,y2)
plt.plot(x,y1,color='red',linewidth=1,linestyle='--')
print(plt.show())
matplotlib.pyplot.plot()参数详解
https://blog.csdn.net/sinat_36219858/article/details/79800460
在交互环境中查看帮助文档:
import matplotlib.pyplot as plt
help(plt.plot)
以下是对帮助文档重要部分的翻译:
plot函数的一般的调用形式:
#单条线:
plot([x], y, [fmt], data=None, **kwargs)
#多条线一起画
plot([x], y, [fmt], [x2], y2, [fmt2], ..., **kwargs)
1.可选参数[fmt] 是一个字符串来定义图的基本属性如:颜色(color),点型(marker),线型(linestyle)
- 具体形式 fmt :
f m t = ′ [ c o l o r ] [ m a r k e r ] [ l i n e ] ′ fmt = '[color][marker][line]' fmt=′[color][marker][line]′
- fmt接收的是每个属性的单个字母缩写,例如:
plot(x, y, 'bo-') # 蓝色圆点实线
2.若属性用的是全名则不能用fmt参数来组合赋值,应该用关键字参数对单个属性赋值如:
plot(x,y2,color='green', marker='o', linestyle='dashed', linewidth=1, markersize=6)
plot(x,y3,color='#900302',marker='+',linestyle='-')
常见的颜色参数:Colors
-
也可以对关键字参数color赋十六进制的RGB字符串如 color=’#900302’
============= =============================== character color ============= =============================== ``'b'`` blue 蓝 ``'g'`` green 绿 ``'r'`` red 红 ``'c'`` cyan 蓝绿 ``'m'`` magenta 洋红 ``'y'`` yellow 黄 ``'k'`` black 黑 ``'w'`` white 白 ============= ============================== -
点型参数Markers,如:marker=’+’ 这个只有简写,英文描述不被识别
=============    ===============================
    character        description
    =============    ===============================
    ``'.'``          point marker
    ``','``          pixel marker
    ``'o'``          circle marker
    ``'v'``          triangle_down marker
    ``'^'``          triangle_up marker
    ``'<'``          triangle_left marker
    ``'>'``          triangle_right marker
    ``'1'``          tri_down marker
    ``'2'``          tri_up marker
    ``'3'``          tri_left marker
    ``'4'``          tri_right marker
    ``'s'``          square marker
    ``'p'``          pentagon marker
    ``'*'``          star marker
    ``'h'``          hexagon1 marker
    ``'H'``          hexagon2 marker
    ``'+'``          plus marker
    ``'x'``          x marker
    ``'D'``          diamond marker
    ``'d'``          thin_diamond marker
    ``'|'``          vline marker
    ``'_'``          hline marker
    =============    ===============================
- 线型参数Line Styles,linestyle=’-’
    =============    ===============================
    character        description
    =============    ===============================
    ``'-'``          solid line style 实线
    ``'--'``         dashed line style 虚线
    ``'-.'``         dash-dot line style 点画线
    ``':'``          dotted line style 点线
    =============    ===============================
样例1
import matplotlib.pyplot as plt
import numpy as np
'''read file
fin=open("para.txt")
a=[]
for i in fin:
  a.append(float(i.strip()))
a=np.array(a)
a=a.reshape(9,3)
'''
a=np.random.random((9,3))*2 #随机生成y

y1=a[0:,0]
y2=a[0:,1]
y3=a[0:,2]

x=np.arange(1,10)

ax = plt.subplot(111)
width=10
hight=3
ax.arrow(0,0,0,hight,width=0.01,head_width=0.1, head_length=0.3,length_includes_head=True,fc='k',ec='k')
ax.arrow(0,0,width,0,width=0.01,head_width=0.1, head_length=0.3,length_includes_head=True,fc='k',ec='k')

ax.axes.set_xlim(-0.5,width+0.2)
ax.axes.set_ylim(-0.5,hight+0.2)

plotdict = { 'dx': x, 'dy': y1 }
ax.plot('dx','dy','bD-',data=plotdict)

ax.plot(x,y2,'r^-')
ax.plot(x,y3,color='#900302',marker='*',linestyle='-')

plt.show()
![]()
样例2
import matplotlib.pyplot as plt
import numpy as np

x = np.arange(0, 2*np.pi, 0.02)
y = np.sin(x)
y1 = np.sin(2*x)
y2 = np.sin(3*x)
ym1 = np.ma.masked_where(y1 > 0.5, y1)
ym2 = np.ma.masked_where(y2 < -0.5, y2)

lines = plt.plot(x, y, x, ym1, x, ym2, 'o')
#设置线的属性
plt.setp(lines[0], linewidth=1)
plt.setp(lines[1], linewidth=2)
plt.setp(lines[2], linestyle='-',marker='^',markersize=4)
#线的标签
plt.legend(('No mask', 'Masked if > 0.5', 'Masked if < -0.5'), loc='upper right')
plt.title('Masked line demo')
plt.show()
![]()
样例3:圆
import numpy as np
import matplotlib.pyplot as plt

theta = np.arange(0, 2*np.pi, 0.01)
xx = [1,2,3,10,15,8]
yy = [1,-1,0,0,7,0]
rr = [7,7,3,6,9,9]

fig = plt.figure()
axes = flg.add_subplot(111)

i = 0
while i < len(xx):
    x = xx[i] + rr[i] *np.cos(theta)
    x = xx[i] + rr[i] *np.cos(theta)
    axes.plot(x,y)
    axes.plot(xx[i], yy[i], color='#900302', marker='*')
     i = i+1
width = 20
hight = 20
axes.arrow(0,0,0,hight,width=0.01,head_width=0.1,head_length=0.3,fc='k',ec='k')
axes.arrow(0,0,width,0,width=0.01,head_width=0.1,head_length=0.3,fc='k',ec='k')
plt.show()
v8 Fixed_bug折线图
import matplotlib.pyplot as plt
import numpy as np
import datetime as dt
import calendar
import xlwt
import pandas as pd
import matplotlib.ticker as ticker
import matplotlib.dates as mdates
#plt.rcParams['font.sans-serif'] = ['SimHei'] # 显示中文
#plt.rcParams['axes.unicode_minus'] = False
df=pd.read_csv('status:Fixed_Type=Bug_2021_11_6/all_csv')
#print(data)
print(df.columns)
#print(df.iloc[:, 10].head(15))
print(df.iloc[:, 11].head())
'''
print('----------------用来检查Closed列的数据是否正常---------------------------')
#df2=pd.DataFrame(columns=['Closed'])
#df2=df['Closed']
#print(df2)
#df2.to_excel('closed.xlsx')
'''
print('---------------数据处理的参考链接:"https://www.cnblogs.com/lemonbit/p/6896499.html"---------------')
#整理数据
df2=pd.DataFrame(columns=['fixed_time','number'])
df2['fixed_time']=pd.to_datetime(df['Closed'])
print('fixed_time:\n',df2['fixed_time'])
df2['number']=1
print(df2)
print(df2.shape)
df2= df2.set_index('fixed_time') # 将fixed_time设置为index
print(df2.head(2))
print(df2.tail(2))
#查看Dataframe的数据类型
print(df2.index)
print(type(df2.index))
#构造Series类型数据
s = pd.Series(df2['number'], index=df2.index)
print(type(s))
s.head(2)
print('------------报错:AssertionError: 的解决方案-------------------' )
df2.index=pd.to_datetime(df2.index) #确保索引是“DatetimeIndex”类型
df2=df2.sort_index() #首先对“索引”进行排序
df2_sub=df2['2021-11']
df2_sub1=df2['2016':'2017']
print(df2_sub,'\n')
print(df2_sub1)
print(df2_sub1.shape)
print('--------------------按月显示,但不统计------------------------------\n')
df2_period=df2.to_period('M')
print(type(df2_period))
print(type(df2_period.index))
print(df2_period.tail(30))
print('--------------------按月统计数据-----------------------------------\n')
df3=pd.DataFrame()
df3=df2.resample('M').sum()#得到了fixed_time的月份和bug数量
print(type(df3))
'''
print('--------------一些基本信息--------------------)
print(df3.columns.values.tolist())
print(df3.head())
print(df3.tail())
print(df3.shape)
print(df3.columns)
print(df3.index)
'''
c=df3.values[:, 0]
print(type(c))
print(c)
df3['fixed_time']=df3.index
print(type(df3.index))
print(df3)
print(df3.shape)
print(df3.columns)
#print(df3)
def data_draw(data):
# 画图函数
time=data.values[:,1] # X轴数据
fig=plt.figure(figsize=(20,10))
plt.tick_params(axis='x', labelsize=12) # 设置x轴标签大小
ax = fig.add_subplot(1,1,1) #(xxx)这里前两个表示几*几的网格,最后一个表示第几子图
plt.tick_params(axis='both', which='major', labelsize=14)
plt.title('v8 siiue tracker: fixed bug',verticalalignment='bottom')
ax.plot(time,data.values[:, 0], 'go-.', linewidth=1,label='Fixed') # 数据的第1列作为Y轴数据
# plt.gcf().autofmt_xdate() # 自动旋转日期标记
handles, labels = ax.get_legend_handles_labels()
ax.legend(handles, labels, loc = 'upper right')
# 设置每月定位符
ax.xaxis.set_major_locator(mdates.MonthLocator(interval=12)) # 设置主刻度,间隔为3
# 设置日期的格式
ax.xaxis.set_major_formatter(mdates.DateFormatter('%Y-%m'))
'''
ticker_spacing=1
ax.xaxis.set_major_locator(ticker.MultipleLocator(ticker_spacing))
plt.xticks(rotation=15)
'''
plt.xticks(rotation=-60) # 设置x轴标签旋转角度
plt.xlabel('Month',fontsize=14)
plt.ylabel('numbers of bug',fontsize=14)
# plt.gcf().autofmt_xdate() # 自动旋转日期标记
print(plt.show())
data_draw(df3)
