第四章.神经网络—单层感知器
第四章.神经网络
4.1 单层感知器
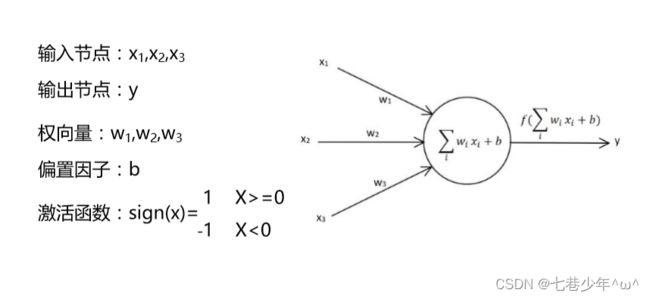
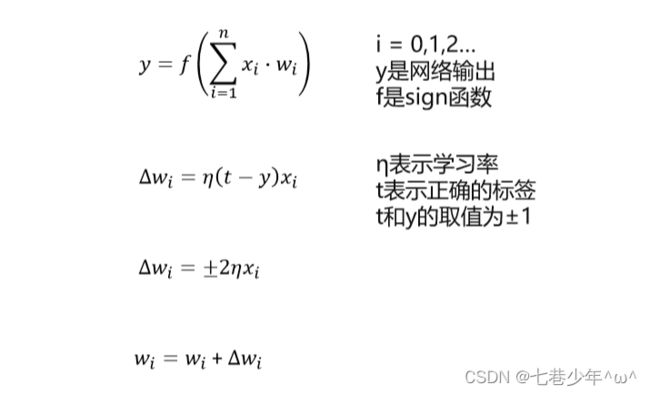
1.单层感知器示意图
1).第一种表示方法:
2).第二种表示方法:
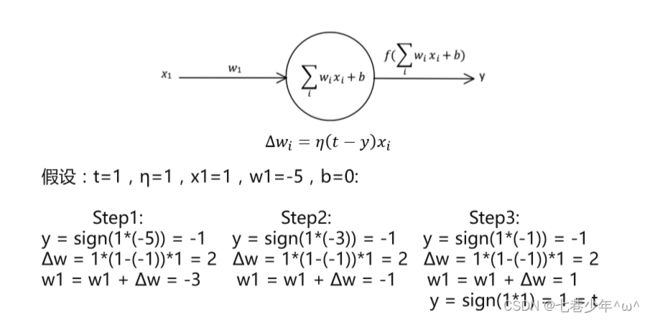
2.学习率η
1).η取值说明:
- η取值一般在0-1之间
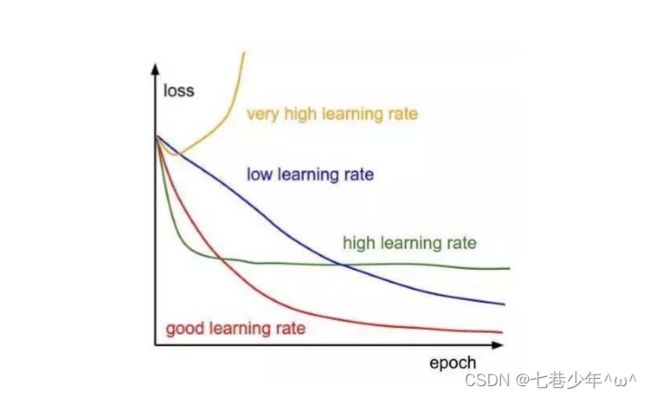
- η太大容易造成权值调整不稳定,η太小容易造成权值调整太慢,调整次数过多
2).不同学习率:
3.模型收敛条件
- 误差小于某个预先设定的较小的值(例如:loss<0.1时,结束迭代)
- 两次迭代之间的权值变化已经很小
- 设定最大迭代次数,当迭代超过最大次数就停止(常用方式)
4.单层感知器示例1
1).题目:
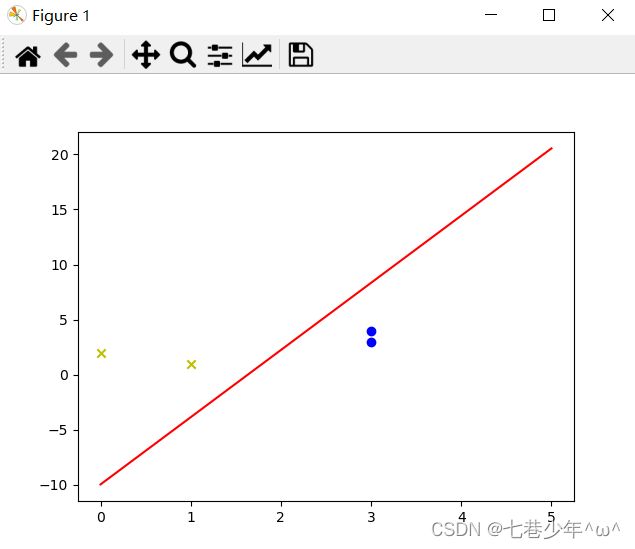
- 假设平面坐标系上有四个点,(3,3),(4,3)这两个点是标签1,(1,1),(0,2)这两个点的标签为-1,构建神经网络来分类。
2).思路:
-
我们要分类的数据是一个二维数据,我们只需要两个输入节点,我们可以把神经元的偏置值也设置为一个输入节点,这样我们就有3个输入节点。

-
输入数据有4个(1,3,3),(1,4,3),(1,1,1),(1,0,2),对应的标签为(1,1,-1,-1),初始化权值为w0,w1,w2取-1到1之间的随机数,学习率η设置为0.11,激活函数为sign函数
-
斜率(k)和截距(b)的公式推导:
①.数据的输入:Xi=[1,xi ,yi ],对应的权重W=[w0 ,w1 ,w2 ]; 求∑ XiWi=0;
②.即求:w0 +xiw1 +yiw2 = 0
③.所以:yiw2 = -w0 -xiw1
④.即:yi= -(w0/w2)-(w1/w2)xi
⑤.斜率k=-(w1/w2)
⑥.截距b=-(w0/w2)
3).代码:
import numpy as np
import matplotlib.pyplot as plt

# 输入数据
X = np.array([[1, 3, 3], [1, 4, 3], [1, 1, 1], [1, 0, 2]])  # shape:[4,3]

# 标签
Y = np.array([[1], [1], [-1], [-1]])  # shape:[4,1]

# 初始化权值,3行1列,取值范围[-1,1],有多少个输入就有多少行,有多少个输出就有多少列
W = (np.random.random([3, 1]) - 0.5) * 2  # shape:[3,1]

# 学习率
lr = 0.11

# 神经网络输出
Output = 0


# 更新权值的函数
def update():
    global X, Y, W, lr
    Output = np.sign(np.dot(X, W))  # shape:[4,1]
    Wi = lr * (X.T.dot(Y - Output)) / int(X.shape[0])  # 除以int(X.shape[0])是因为lr*(X.T.dot(Y-Output))是误差和
    W = W + Wi


epochs = 100
for i in range(epochs):
    update()
    print(i, W)
    Output = np.sign(np.dot(X, W))  # shape:[4,1]
    if (Output == Y).all():
        print('finished')
        print('epochs:', i)
        break

# 正样本
x1 = [3, 3]
y1 = [4, 3]

# 负样本
x2 = [1, 0]
y2 = [1, 2]

# 计算分界线的斜率以及截距
k = -W[1] / W[2]
b = -W[0] / W[2]

print('k=', k)
print('b=', b)

xdata = (0, 5)

# 创建画布
plt.figure()
plt.scatter(x1, y1, c='b', marker='o')
plt.scatter(x2, y2, c='y', marker='x')
plt.plot(xdata, xdata * k + b, 'r')
plt.show()
4).结果展示:
5.单层感知器示例2—异或问题
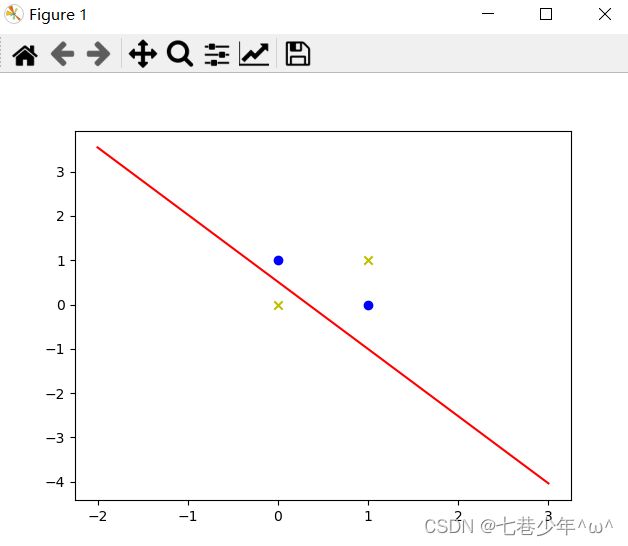
若a,b两个值相同,则异或结果为0,若a,b两个值不同,则异或结果为1。
1).代码:
import numpy as np
import matplotlib.pyplot as plt

# 输入数据
X = np.array([[1, 0, 0], [1, 0, 1], [1, 1, 0], [1, 1, 1]])

# 标签
Y = np.array([[-1], [1], [1], [-1]])

# 随机初始化权重
W = (np.random.random([3, 1]) - 0.5) * 2
print(W)

# 学习率
lr = 0.11

# 神经网络的输出
Output = 0


# 权重更新函数
def update():
    global X, Y, W, lr
    Output = np.sign(np.dot(X, W))
    Wi = lr * (X.T.dot(Y - Output)) / int(X.shape[0])
    W = W + Wi


epochs = 100
for i in range(epochs):
    update()
    if (Output == Y).all():
        print('Finished')
        print('Weight:', W, ',epoch:', i)
        break

# 正样本
x1 = [0, 1]
y1 = [1, 0]

# 负样本
x2 = [0, 1]
y2 = [0, 1]

# 计算分界线的斜率和截距
k = -W[1] / W[2]
b = -W[0] / W[2]
print('k=', k)
print('b=', b)

x_data = [-2, 3]
y_data = k * x_data + b

# 画图
plt.figure()
plt.scatter(x1, y1, c='b', marker='o')
plt.scatter(x2, y2, c='y', marker='x')
plt.plot(x_data, y_data, 'r')
plt.show()
