时间序列, 智能运维
时间序列的自回归模型—从线性代数的角度来看
MARCH 23, 2018
时间序列, 智能运维
时间序列的搜索
MARCH 14, 2018
时间序列, 智能运维
如何理解时间序列?— 从RIEMANN积分和LEBESGUE积分谈起
MARCH 10, 2018
Riemann 积分和 Lebesgue 积分是数学中两个非常重要的概念。本文将会从 Riemann 积分和 Lebesgue 积分的定义出发,介绍它们各自的性质和联系。
积分
Riemann 积分
Riemann 积分虽然被称为 Riemann 积分,但是在 Riemann 之前就有学者对这类积分进行了详细的研究。早在阿基米德时代,阿基米德为了计算曲线  在 [0,1] 区间上与 X 坐标轴所夹的图形面积,就使用了 Riemann 积分的思想。 他把 [0,1] 区间等长地切割成 n 段,每一段使用一个长方形去逼近
  这条曲线的分段面积,再把 n 取得很大,所以得到当 n 趋近于无穷的时候,就知道该面积其实是 1/3。
下面来看一下 Riemann 积分的详细定义。
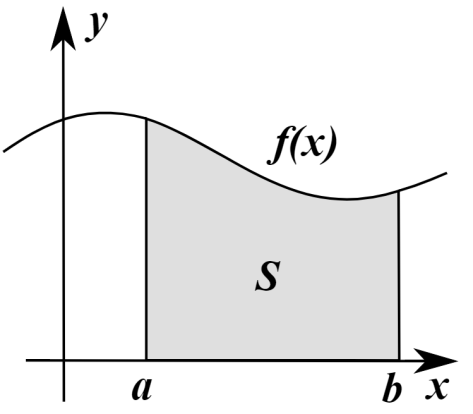
考虑定义在闭区间 [a,b] 上的函数  ,
,
取一个有限的点列  ,
, 表示这些区间长度的最大值,在这里
  。在每一个子区间上
![[x_{i},x_{i+1}] [x_{i},x_{i+1}]](http://img.e-com-net.com/image/info8/3aa21c42a1264590b3c0da7e0e8ca809.png) 上取出一个点
上取出一个点 ![t_{i}\in[x_{i},x_{i+1}] t_{i}\in[x_{i},x_{i+1}]](http://img.e-com-net.com/image/info8/abe4fa5ffe7d4fd4982772b941a78f7d.png) 。而函数
。而函数  关于以上取样分割的 Riemann 和就是以下公式:

当我们说该函数  在闭区间
在闭区间 ![[a,b] [a,b]](http://img.e-com-net.com/image/info8/6858e280883648648dfcb9d33d364cc0.png) 上的取值是
上的取值是  的意思是:
的意思是:
对于任意  ,存在
,存在  使得对于任意取样分割,当
  时,就有
时,就有

通常来说,用符号来表示就是: .
.
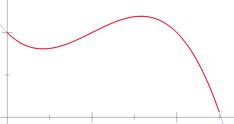
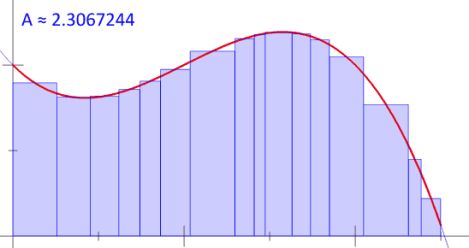
用几幅图来描述 Riemann 积分的思想就是:
Lebesgue 积分
Riemann 积分是为了计算曲线与 X 轴所围成的面积,而 Lebesgue 积分也是做同样的事情,但是计算面积的方法略有不同。要想直观的解释两种积分的原理,可以参见下图:
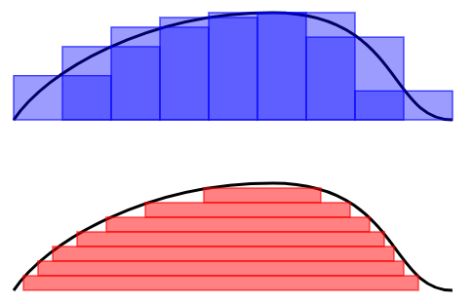
Riemann 积分(上)与 Lebesgue 积分(下)
Riemann 积分是把一条曲线的底部分成等长的区间,测量每一个区间上的曲线高度,所以总面积就是这些区间与高度所围成的面积和。
Lebesgue 积分是把曲线化成等高线图,每两根相邻等高线的差值是一样的。每根等高线之内含有它所圈着的长度,因此总面积就是这些等高线内的面积之和。
用再形象一点的语言来描述就是:吃一块汉堡有多种方式
- Riemann 积分:从一个角落开始一口一口吃,每口都包含所有的配料;
- Lebesgue 积分:从最上层开始吃,按照“面包-配菜-肉-蛋-面包”的节奏,一层一层来吃。
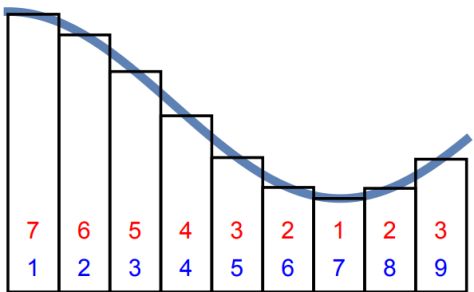
再看一幅图的表示就是:Riemann 积分是按照蓝色的数字顺序相加的,Lebesgue 积分是按照红色的数字来顺序相加的。
基于这些基本的思想,就可以给出 Lebesgue 积分的定义:
简单函数指的是对指示函数的有限线性组合,i.e.  ,这里的
,这里的  是系数,
是系数, 是可测集合,
 表示指示函数。当
  非负时,令
非负时,令

如果  是一个非负可测函数时,可以定义函数
  在可测集合
在可测集合  上的 Lebesgue 积分是:
 ,
,
这里的  指的是非负简单函数,
 表示零函数,这里的大小关系表示对定义域内的每个点都要成立。
而对于可测函数时,可以把可测函数  转换成
转换成  ,而这里的
,而这里的  和
和  都是非负可测函数。所以可以定义任意可测函数的 Lebesgue 积分如下:
 .
.
Riemann 积分与Lebesgue 积分的关系
定义了两种积分之后,也许有人会问它们之间是否存在矛盾?其实,它们之间是不矛盾的,因为有学者证明了这样的定理:
如果有界函数  在闭区间
在闭区间 ![[a,b] [a,b]](http://img.e-com-net.com/image/info8/6858e280883648648dfcb9d33d364cc0.png) 是 Riemann 可积的,则它也是 Lebesgue 可积的,并且它们的积分值相等:
是 Riemann 可积的,则它也是 Lebesgue 可积的,并且它们的积分值相等:
![(R)\int_{a}^{b}f(x)dx = (L)\int_{[a,b]}f(x)dx (R)\int_{a}^{b}f(x)dx = (L)\int_{[a,b]}f(x)dx](http://img.e-com-net.com/image/info8/f25ab2878e724f73a7d2c0304a889cfd.png) .
.
左侧是表示 Riemann 积分,右侧表示 Lebesgue 积分。
用形象化一点的语言描述就是:无论从角落一口一口地吃汉堡,还是从顶至下一层一层吃,所吃的汉堡都是同一个。
但是 Lebesgue 积分比 Riemann 积分有着更大的优势,例如 Dirichlet 函数,
- 当
 是有理数时,
 ;
;
- 当
 是无理数时,
 .
.
Dirichlet 函数是定义在实数轴的函数,并且值域是  ,无法画出函数图像,它不是 Riemann 可积的,但是它 Lebesgue 可积。
时间序列
提到时间序列,也就是把以上所讨论的连续函数换成离散函数而已,把定义域从一个闭区间 ![[a,b] [a,b]](http://img.e-com-net.com/image/info8/6858e280883648648dfcb9d33d364cc0.png) 换成
换成  这样的定义域而已。所以,之前所讨论的很多连续函数的想法都可以应用在时间序列上。
时间序列的表示 — 基于 Riemann 积分
现在我们可以按照 Riemann 积分的计算方法来表示一个时间序列的特征,于是就有学者把时间序列按照横轴切分成很多段,每一段使用某个简单函数(线性函数等)来表示,于是就有了以下的方法:
- 分段线性逼近(Piecewise Linear Approximation)
- 分段聚合逼近(Piecewise Aggregate Approximation)
- 分段常数逼近(Piecewise Constant Approximation)
说到这几种算法,其实最本质的思想就是进行数据降维的工作,用少数的数据来进行原始时间序列的表示(Representation)。用数学化的语言来描述时间序列的数据降维(Data Reduction)就是:把原始的时间序列  用
用  来表示,其中
  。那么后者就是原始序列的一种表示(representation)。
分段聚合逼近(Piecewise Aggregate Approximation)— 类似 Riemann 积分
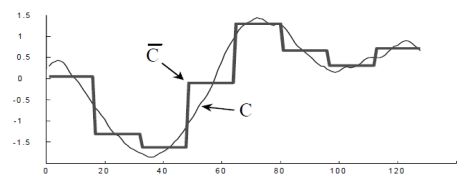
在这种算法中,分段聚合逼近(Piecewise Aggregate Approximation)是一种非常经典的算法。假设原始的时间序列是  ,定义 PAA 的序列是:
 ,
,
其中
 .
.
在这里  。用图像来表示那就是:
至于分段线性逼近(Piecewise Linear Approximation)和分段常数逼近(Piecewise Constant Approximation),只需要在  的定义上稍作修改即可。
符号特征(Symbolic Approximation)— 类似用简单函数来计算 Lebesgue 积分
在推荐系统的特征工程里面,特征通常来说可以做归一化,二值化,离散化等操作。例如,用户的年龄特征,一般不会直接使用具体的年月日,而是划分为某个区间段,例如 0~6(婴幼儿时期),7~12(小学),13~17(中学),18~22(大学)等阶段。
其实在得到分段特征之后,分段特征在某种程度上来说依旧是某些连续值,能否把连续值划分为一些离散的值呢?于是就有学者使用一些符号来表示时间序列的关键特征,也就是所谓的符号表示法(Symbolic Representation)。下面来介绍经典的 SAX Representation。
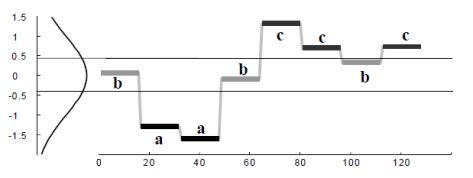
如果我们希望使用  个符号来表示时间序列,那么我们其实可以考虑正态分布
  ,用
,用 来表示 Gauss 曲线下方的一些点,而这些点把 Gauss 曲线下方的面积等分成了
  段。用
段。用  表示
表示  个字母。
个字母。
SAX 方法的流程如下:
- 正规化(normalization):把原始的时间序列映射到一个新的时间序列,新的时间序列满足均值为零,方差为一的条件。
- 分段表示(PAA):
 。
。
- 符号表示(SAX):如果
 ,那么
,那么  ;如果
;如果  ,那么
,那么  ,在这里
,在这里  ;如果
;如果  ,那么
,那么  。
。
于是,我们就可以用  这
这  个字母来表示原始的时间序列了。
时间序列的表示 — 基于 Lebesgue 积分
要想考虑一个时间序列的值分布情况,其实就类似于 Lebesgue 积分的计算方法,考虑它们的分布情况,然后使用某些函数去逼近时间序列。要考虑时间序列的值分布情况,可以考虑熵的概念。
熵(Entropy)
通常来说,要想描述一种确定性与不确定性,熵(entropy)是一种不错的指标。对于离散空间而言,一个系统的熵(entropy)可以这样来表示:
 .
.
如果一个系统的熵(entropy)越大,说明这个系统就越混乱;如果一个系统的熵越小,那么说明这个系统就更加确定。
提到时间序列的熵特征,一般来说有几个经典的熵指标,其中有一个就是 binned entropy。
分桶熵(Binned Entropy)
从熵的定义出发,可以考虑把时间序列的值进行分桶的操作,例如,可以把 [min, max] 这个区间等分为十个小区间,那么时间序列的取值就会分散在这十个桶中。根据这个等距分桶的情况,就可以计算出这个概率分布的熵(entropy)。i.e. Binned Entropy 就可以定义为:

其中  表示时间序列 X 的取值落在第 k 个桶的比例(概率),maxbin 表示桶的个数,len(X) 表示时间序列 X 的长度。
如果一个时间序列的 Binned Entropy 较大,说明这一段时间序列的取值是较为均匀的分布在 [min, max] 之间的;如果一个时间序列的 Binned Entropy 较小,说明这一段时间序列的取值是集中在某一段上的。
总结
在本篇文章中,笔者从 Riemann 积分和 Lebesgue 积分出发,介绍了它们的基本概念,性质和联系。然后从两种积分出发,探讨了时间序列的分段特征,时间序列的熵特征。在未来的 Blog 中,笔者将会介绍时间序列的更多相关内容。
时间序列, 智能运维
时间序列的相似性
MARCH 9, 2018
时间序列, 智能运维
时间序列的表示与信息提取
MARCH 7, 2018
提到时间序列,大家能够想到的就是一串按时间排序的数据,但是在这串数字背后有着它特殊的含义,那么如何进行时间序列的表示(Representation),如何进行时间序列的信息提取(Information Extraction)就成为了时间序列研究的关键问题。
就笔者的个人经验而言,其实时间序列的一些想法和文本挖掘是非常类似的。通常来说句子都是由各种各样的词语组成的,并且一般情况下都是“主谓宾”的句子结构。于是就有人希望把词语用一个数学上的向量描述出来,那么最经典的做法就是使用 one – hot 的编码格式。i.e. 也就是对字典里面的每一个词语进行编码,一个词语对应着一个唯一的数字,例如 0,1,2 这种形式。one hot 的编码格式是这行向量的长度是词典中词语的个数,只有一个值是1,其余的取值是0,也就是 (0,…,0,1,0,…,0) 这种样子。但是在一般情况下,词语的个数都是非常多的,如何使用一个维度较小的向量来表示一个词语就成为了一个关键的问题。几年前,GOOGLE 公司开源了 Word2vec 开源框架,把每一个词语用一串向量来进行描述,向量的长度可以自行调整,大约是100~1000 不等,就把原始的 one-hot 编码转换为了一个低维空间的向量。在这种情况下,机器学习的很多经典算法,包括分类,回归,聚类等都可以在文本上得到巨大的使用。Word2vec 是采用神经网络的思想来提取每个词语与周边词语的关系,从而把每个词语用一个低维向量来表示。在这里,时间序列的特征提取方法与 word2vec 略有不同,后面会一一展示这些技巧。
时间序列的统计特征
提到时间序列的统计特征,一般都能够想到最大值(max),最小值(min),均值(mean),中位数(median),方差(variance),标准差(standard variance)等指标,不过一般的统计书上还会介绍两个指标,那就是偏度(skewness)和峰度(kuriosis)。如果使用时间序列  来表示长度为
  的时间序列,那么这些统计特征用数学公式来表示就是:


![\text{skewness}(X) = E[(\frac{X-\mu}{\sigma})^{3}]=\frac{1}{T}\sum_{i=1}^{T}\frac{(x_{i}-\mu)^{3}}{\sigma^{3}}, \text{skewness}(X) = E[(\frac{X-\mu}{\sigma})^{3}]=\frac{1}{T}\sum_{i=1}^{T}\frac{(x_{i}-\mu)^{3}}{\sigma^{3}},](http://img.e-com-net.com/image/info8/2689e543b09c42ffacf4ba220388eaae.png)
![\text{kurtosis}(X) = E[(\frac{X-\mu}{\sigma})^{4}]=\frac{1}{T}\sum_{i=1}^{T}\frac{(x_{i}-\mu)^{4}}{\sigma^{4}} . \text{kurtosis}(X) = E[(\frac{X-\mu}{\sigma})^{4}]=\frac{1}{T}\sum_{i=1}^{T}\frac{(x_{i}-\mu)^{4}}{\sigma^{4}} .](http://img.e-com-net.com/image/info8/837578044870437ea565cd2a0916523b.png)
其中  和
和  分别表示时间序列
  的均值和方差。
时间序列的熵特征
为什么要研究时间序列的熵呢?请看下面两个时间序列:
时间序列(1):(1,2,1,2,1,2,1,2,1,2,…)
时间序列(2):(1,1,2,1,2,2,2,2,1,1,…)
在时间序列(1)中,1 和 2 是交替出现的,而在时间序列(2)中,1 和 2 是随机出现的。在这种情况下,时间序列(1)则更加确定,时间序列(2)则更加随机。并且在这种情况下,两个时间序列的统计特征,例如均值,方差,中位数等等则是几乎一致的,说明用之前的统计特征并不足以精准的区分这两种时间序列。
通常来说,要想描述一种确定性与不确定性,熵(entropy)是一种不错的指标。对于离散空间而言,一个系统的熵(entropy)可以这样来表示:

如果一个系统的熵(entropy)越大,说明这个系统就越混乱;如果一个系统的熵越小,那么说明这个系统就更加确定。
提到时间序列的熵特征,一般来说有几个经典的例子,那就是 binned entropy,approximate entropy,sample entropy。下面来一一介绍时间序列中这几个经典的熵。
Binned Entropy
从熵的定义出发,可以考虑把时间序列  的取值进行分桶的操作。例如,可以把
 ![[\min(X_{T}), \max(X_{T})] [\min(X_{T}), \max(X_{T})]](http://img.e-com-net.com/image/info8/5726c93eb569421c88a741e15b4e1f75.png) 这个区间等分为十个小区间,那么时间序列的取值就会分散在这十个桶中。根据这个等距分桶的情况,就可以计算出这个概率分布的熵(entropy)。i.e. Binned Entropy 就可以定义为:
这个区间等分为十个小区间,那么时间序列的取值就会分散在这十个桶中。根据这个等距分桶的情况,就可以计算出这个概率分布的熵(entropy)。i.e. Binned Entropy 就可以定义为:

其中  表示时间序列
  的取值落在第
  个桶的比例(概率),
 表示桶的个数,
 表示时间序列
  的长度。
的长度。
如果一个时间序列的 Binned Entropy 较大,说明这一段时间序列的取值是较为均匀的分布在 ![[\min(X_{T}), \max(X_{T})] [\min(X_{T}), \max(X_{T})]](http://img.e-com-net.com/image/info8/5726c93eb569421c88a741e15b4e1f75.png) 之间的;如果一个时间序列的 Binned Entropy 较小,说明这一段时间序列的取值是集中在某一段上的。
之间的;如果一个时间序列的 Binned Entropy 较小,说明这一段时间序列的取值是集中在某一段上的。
Approximate Entropy
回到本节的问题,如何判断一个时间序列是否具备某种趋势还是随机出现呢?这就需要介绍 Approximate Entropy 的概念了,Approximate Entropy 的思想就是把一维空间的时间序列提升到高维空间中,通过高维空间的向量之间的距离或者相似度的判断,来推导出一维空间的时间序列是否存在某种趋势或者确定性。那么,我们现在可以假设时间序列  的长度是
的长度是  ,同时 Approximate Entropy 函数拥有两个参数,
 与
与  ,下面来详细介绍 Approximate Entropy 的算法细节。
Step 1. 固定两个参数,正整数  和正数
和正数  ,正整数
,正整数  是为了把时间序列进行一个片段的提取,正数
  是表示时间序列距离的某个参数。i.e. 需要构造新的
  维向量如下:


Step 2. 通过新的向量  ,可以计算出哪些向量与
  较为相似。i.e.

在这里,距离  可以选择
可以选择  范数。在这个场景下,距离
  通常选择为
通常选择为  范数。
范数。
Step 3. 考虑函数

Step 4. Approximate Entropy 可以定义为:

Remark.
- 正整数
 一般可以取值为 2 或者 3,
 会基于具体的时间序列具体调整;
- 如果某条时间序列具有很多重复的片段(repetitive pattern)或者自相似性(self-similarity pattern),那么它的 Approximate Entropy 就会相对小;反之,如果某条时间序列几乎是随机出现的,那么它的 Approximate Entropy 就会相对较大。
Sample Entropy
除了 Approximate Entropy,还有另外一个熵的指标可以衡量时间序列,那就是 Sample Entropy,通过自然对数的计算来表示时间序列是否具备某种自相似性。
按照以上 Approximate Entropy 的定义,可以基于  与
与  定义两个指标
  和
和  ,分别是
,分别是


其中, 表示集合的元素个数。根据度量
  (无论是
(无论是  )的定义可以知道
 ,因此 Sample Entropy 总是非负数,i.e.

Remark.
- Sample Entropy 总是非负数;
- Sample Entropy 越小表示该时间序列具有越强的自相似性(self similarity)。
- 通常来说,在 Sample Entropy 的参数选择中,可以选择
 .
.
时间序列的分段特征
即使时间序列有一定的自相似性(self-similarity),能否说明这两条时间序列就完全相似呢?其实答案是否定的,例如:两个长度都是 1000 的时间序列,
时间序列(1): [1,2] * 500
时间序列(2): [1,2,3,4,5,6,7,8,9,10] * 100
其中,时间序列(1)是 1 和 2 循环的,时间序列(2)是 1~10 这样循环的,它们从图像上看完全是不一样的曲线,并且它们的 Approximate Entropy 和 Sample Entropy 都是非常小的。那么问题来了,有没有办法提炼出信息,从而表示它们的不同点呢?答案是肯定的。
首先,我们可以回顾一下 Riemann 积分和 Lebesgue 积分的定义和不同之处。按照下面两幅图所示,Riemann 积分是为了算曲线下面所围成的面积,因此把横轴划分成一个又一个的小区间,按照长方形累加的算法来计算面积。而 Lebesgue 积分的算法恰好相反,它是把纵轴切分成一个又一个的小区间,然后也是按照长方形累加的算法来计算面积。

之前的 Binned Entropy 方案是根据值域来进行切分的,好比 Lebesgue 积分的计算方法。现在我们可以按照 Riemann 积分的计算方法来表示一个时间序列的特征,于是就有学者把时间序列按照横轴切分成很多段,每一段使用某个简单函数(线性函数等)来表示,于是就有了以下的方法:
- 分段线性逼近(Piecewise Linear Approximation)
- 分段聚合逼近(Piecewise Aggregate Approximation)
- 分段常数逼近(Piecewise Constant Approximation)
说到这几种算法,其实最本质的思想就是进行数据降维的工作,用少数的数据来进行原始时间序列的表示(Representation)。用数学化的语言来描述时间序列的数据降维(Data Reduction)就是:把原始的时间序列  用
用  来表示,其中
  。那么后者就是原始序列的一种表示(representation)。
分段聚合逼近(Piecewise Aggregate Approximation)— 类似 Riemann 积分
在这种算法中,分段聚合逼近(Piecewise Aggregate Approximation)是一种非常经典的算法。假设原始的时间序列是  ,定义 PAA 的序列是:
 ,
,
其中
 .
.
在这里  。用图像来表示那就是:

至于分段线性逼近(Piecewise Linear Approximation)和分段常数逼近(Piecewise Constant Approximation),只需要在  的定义上稍作修改即可。
符号逼近(Symbolic Approximation)— 类似 Riemann 积分
在推荐系统的特征工程里面,特征通常来说可以做归一化,二值化,离散化等操作。例如,用户的年龄特征,一般不会直接使用具体的年月日,而是划分为某个区间段,例如 0~6(婴幼儿时期),7~12(小学),13~17(中学),18~22(大学)等阶段。
其实在得到分段特征之后,分段特征在某种程度上来说依旧是某些连续值,能否把连续值划分为一些离散的值呢?于是就有学者使用一些符号来表示时间序列的关键特征,也就是所谓的符号表示法(Symbolic Representation)。下面来介绍经典的 SAX Representation。
如果我们希望使用  个符号,例如
  来表示时间序列。同时考虑正态分布
  ,用
,用 来表示 Gauss 曲线下方的一些点,而这些点把 Gauss 曲线下方的面积等分成了
  段。
段。
SAX 方法的流程如下:
Step 1. 正规化(normalization):也就是该时间序列被映射到均值为零,方差为一的区间内。
Step 2. 分段表示(PAA): 。
。
Step 3. 符号表示(SAX):如果  ,那么
,那么  ;如果
;如果  ,那么
,那么  ;如果
;如果  ,那么
,那么  。
。
于是,我们就可以用  这
这  个字母来表示原始的时间序列了。
 、
、
总结
在本篇文章中,我们介绍了时间序列的一些表示方法(Representation),其中包括时间序列统计特征,时间序列的熵特征,时间序列的分段特征。在下一篇文章中,我们将会介绍时间序列的相似度计算方法。
时间序列
HOW TO CONVERT A TIME SERIES TO A SUPERVISED LEARNING PROBLEM IN PYTHON
SEPTEMBER 15, 2017
https://machinelearningmastery.com/convert-time-series-supervised-learning-problem-python/
Machine learning methods like deep learning can be used for time series forecasting.
Before machine learning can be used, time series forecasting problems must be re-framed as supervised learning problems. From a sequence to pairs of input and output sequences.
In this tutorial, you will discover how to transform univariate and multivariate time series forecasting problems into supervised learning problems for use with machine learning algorithms.
After completing this tutorial, you will know:
- How to develop a function to transform a time series dataset into a supervised learning dataset.
- How to transform univariate time series data for machine learning.
- How to transform multivariate time series data for machine learning.
Let’s get started.
Time Series vs Supervised Learning
Before we get started, let’s take a moment to better understand the form of time series and supervised learning data.
A time series is a sequence of numbers that are ordered by a time index. This can be thought of as a list or column of ordered values.
For example:
A supervised learning problem is comprised of input patterns (X) and output patterns (y), such that an algorithm can learn how to predict the output patterns from the input patterns.
For example:
|
|
X, y
1 2
2, 3
3, 4
4, 5
5, 6
6, 7
7, 8
8, 9
|
For more on this topic, see the post:
- Time Series Forecasting as Supervised Learning
Pandas shift() Function
A key function to help transform time series data into a supervised learning problem is the Pandas shift() function.
Given a DataFrame, the shift() function can be used to create copies of columns that are pushed forward (rows of NaN values added to the front) or pulled back (rows of NaN values added to the end).
This is the behavior required to create columns of lag observations as well as columns of forecast observations for a time series dataset in a supervised learning format.
Let’s look at some examples of the shift function in action.
We can define a mock time series dataset as a sequence of 10 numbers, in this case a single column in a DataFrame as follows:
|
|
from pandas import DataFrame
df = DataFrame ( )
df [ ‘t’ ] = [ x for x in range ( 10 ) ]
print ( df )
|
Running the example prints the time series data with the row indices for each observation.
|
|
t
0 0
1 1
2 2
3 3
4 4
5 5
6 6
7 7
8 8
9 9
|
We can shift all the observations down by one time step by inserting one new row at the top. Because the new row has no data, we can use NaN to represent “no data”.
The shift function can do this for us and we can insert this shifted column next to our original series.
|
|
from pandas import DataFrame
df = DataFrame ( )
df [ ‘t’ ] = [ x for x in range ( 10 ) ]
df [ ‘t-1’ ] = df [ ‘t’ ] . shift ( 1 )
print ( df )
|
Running the example gives us two columns in the dataset. The first with the original observations and a new shifted column.
We can see that shifting the series forward one time step gives us a primitive supervised learning problem, although with X and y in the wrong order. Ignore the column of row labels. The first row would have to be discarded because of the NaN value. The second row shows the input value of 0.0 in the second column (input or X) and the value of 1 in the first column (output or y).
|
|
t t-1
0 0 NaN
1 1 0.0
2 2 1.0
3 3 2.0
4 4 3.0
5 5 4.0
6 6 5.0
7 7 6.0
8 8 7.0
9 9 8.0
|
We can see that if we can repeat this process with shifts of 2, 3, and more, how we could create long input sequences (X) that can be used to forecast an output value (y).
The shift operator can also accept a negative integer value. This has the effect of pulling the observations up by inserting new rows at the end. Below is an example:
|
|
from pandas import DataFrame
df = DataFrame ( )
df [ ‘t’ ] = [ x for x in range ( 10 ) ]
df [ ‘t+1’ ] = df [ ‘t’ ] . shift ( – 1 )
print ( df )
|
Running the example shows a new column with a NaN value as the last value.
We can see that the forecast column can be taken as an input (X) and the second as an output value (y). That is the input value of 0 can be used to forecast the output value of 1.
|
|
t t+1
0 0 1.0
1 1 2.0
2 2 3.0
3 3 4.0
4 4 5.0
5 5 6.0
6 6 7.0
7 7 8.0
8 8 9.0
9 9 NaN
|
Technically, in time series forecasting terminology the current time (t) and future times (t+1, t+n) are forecast times and past observations (t-1, t-n) are used to make forecasts.
We can see how positive and negative shifts can be used to create a new DataFrame from a time series with sequences of input and output patterns for a supervised learning problem.
This permits not only classical X -> y prediction, but also X -> Y where both input and output can be sequences.
Further, the shift function also works on so-called multivariate time series problems. That is where instead of having one set of observations for a time series, we have multiple (e.g. temperature and pressure). All variates in the time series can be shifted forward or backward to create multivariate input and output sequences. We will explore this more later in the tutorial.
The series_to_supervised() Function
We can use the shift() function in Pandas to automatically create new framings of time series problems given the desired length of input and output sequences.
This would be a useful tool as it would allow us to explore different framings of a time series problem with machine learning algorithms to see which might result in better performing models.
In this section, we will define a new Python function named series_to_supervised() that takes a univariate or multivariate time series and frames it as a supervised learning dataset.
The function takes four arguments:
- data: Sequence of observations as a list or 2D NumPy array. Required.
- n_in: Number of lag observations as input (X). Values may be between [1..len(data)] Optional. Defaults to 1.
- n_out: Number of observations as output (y). Values may be between [0..len(data)-1]. Optional. Defaults to 1.
- dropnan: Boolean whether or not to drop rows with NaN values. Optional. Defaults to True.
The function returns a single value:
- return: Pandas DataFrame of series framed for supervised learning.
The new dataset is constructed as a DataFrame, with each column suitably named both by variable number and time step. This allows you to design a variety of different time step sequence type forecasting problems from a given univariate or multivariate time series.
Once the DataFrame is returned, you can decide how to split the rows of the returned DataFrame into X and y components for supervised learning any way you wish.
The function is defined with default parameters so that if you call it with just your data, it will construct a DataFrame with t-1 as X and t as y.
The function is confirmed to be compatible with Python 2 and Python 3.
The complete function is listed below, including function comments.
1
2
3
4
5
6
7
8
9
10
11
12
13
14
15
16
17
18
19
20
21
22
23
24
25
26
27
28
29
30
31
32
33
34
35
|
from pandas import DataFrame
from pandas import concat
def series_to_supervised ( data , n_in = 1 , n_out = 1 , dropnan = True ) :
“” “
Frame a time series as a supervised learning dataset.
Arguments:
data: Sequence of observations as a list or NumPy array.
n_in: Number of lag observations as input (X).
n_out: Number of observations as output (y).
dropnan: Boolean whether or not to drop rows with NaN values.
Returns:
Pandas DataFrame of series framed for supervised learning.
“ “”
n_vars = 1 if type ( data ) is list else data . shape [ 1 ]
df = DataFrame ( data )
cols , names = list ( ) , list ( )
# input sequence (t-n, … t-1)
for i in range ( n_in , 0 , – 1 ) :
cols . append ( df . shift ( i ) )
names += [ ( ‘var%d(t-%d)’ % ( j + 1 , i ) ) for j in range ( n_vars ) ]
# forecast sequence (t, t+1, … t+n)
for i in range ( 0 , n_out ) :
cols . append ( df . shift ( – i ) )
if i == 0 :
names += [ ( ‘var%d(t)’ % ( j + 1 ) ) for j in range ( n_vars ) ]
else :
names += [ ( ‘var%d(t+%d)’ % ( j + 1 , i ) ) for j in range ( n_vars ) ]
# put it all together
agg = concat ( cols , axis = 1 )
agg . columns = names
# drop rows with NaN values
if dropnan :
agg . dropna ( inplace = True )
return agg
|
Can you see obvious ways to make the function more robust or more readable?
Please let me know in the comments below.
Now that we have the whole function, we can explore how it may be used.
One-Step Univariate Forecasting
It is standard practice in time series forecasting to use lagged observations (e.g. t-1) as input variables to forecast the current time step (t).
This is called one-step forecasting.
The example below demonstrates a one lag time step (t-1) to predict the current time step (t).
1
2
3
4
5
6
7
8
9
10
11
12
13
14
15
16
17
18
19
20
21
22
23
24
25
26
27
28
29
30
31
32
33
34
35
36
37
38
39
40
|
from pandas import DataFrame
from pandas import concat
def series_to_supervised ( data , n_in = 1 , n_out = 1 , dropnan = True ) :
“” “
Frame a time series as a supervised learning dataset.
Arguments:
data: Sequence of observations as a list or NumPy array.
n_in: Number of lag observations as input (X).
n_out: Number of observations as output (y).
dropnan: Boolean whether or not to drop rows with NaN values.
Returns:
Pandas DataFrame of series framed for supervised learning.
“ “”
n_vars = 1 if type ( data ) is list else data . shape [ 1 ]
df = DataFrame ( data )
cols , names = list ( ) , list ( )
# input sequence (t-n, … t-1)
for i in range ( n_in , 0 , – 1 ) :
cols . append ( df . shift ( i ) )
names += [ ( ‘var%d(t-%d)’ % ( j + 1 , i ) ) for j in range ( n_vars ) ]
# forecast sequence (t, t+1, … t+n)
for i in range ( 0 , n_out ) :
cols . append ( df . shift ( – i ) )
if i == 0 :
names += [ ( ‘var%d(t)’ % ( j + 1 ) ) for j in range ( n_vars ) ]
else :
names += [ ( ‘var%d(t+%d)’ % ( j + 1 , i ) ) for j in range ( n_vars ) ]
# put it all together
agg = concat ( cols , axis = 1 )
agg . columns = names
# drop rows with NaN values
if dropnan :
agg . dropna ( inplace = True )
return agg
values = [ x for x in range ( 10 ) ]
data = series_to_supervised ( values )
print ( data )
|
Running the example prints the output of the reframed time series.
|
|
var1(t-1) var1(t)
1 0.0 1
2 1.0 2
3 2.0 3
4 3.0 4
5 4.0 5
6 5.0 6
7 6.0 7
8 7.0 8
9 8.0 9
|
We can see that the observations are named “var1” and that the input observation is suitably named (t-1) and the output time step is named (t).
We can also see that rows with NaN values have been automatically removed from the DataFrame.
We can repeat this example with an arbitrary number length input sequence, such as 3. This can be done by specifying the length of the input sequence as an argument; for example:
|
|
data = series_to_supervised ( values , 3 )
|
The complete example is listed below.
1
2
3
4
5
6
7
8
9
10
11
12
13
14
15
16
17
18
19
20
21
22
23
24
25
26
27
28
29
30
31
32
33
34
35
36
37
38
39
40
|
from pandas import DataFrame
from pandas import concat
def series_to_supervised ( data , n_in = 1 , n_out = 1 , dropnan = True ) :
“” “
Frame a time series as a supervised learning dataset.
Arguments:
data: Sequence of observations as a list or NumPy array.
n_in: Number of lag observations as input (X).
n_out: Number of observations as output (y).
dropnan: Boolean whether or not to drop rows with NaN values.
Returns:
Pandas DataFrame of series framed for supervised learning.
“ “”
n_vars = 1 if type ( data ) is list else data . shape [ 1 ]
df = DataFrame ( data )
cols , names = list ( ) , list ( )
# input sequence (t-n, … t-1)
for i in range ( n_in , 0 , – 1 ) :
cols . append ( df . shift ( i ) )
names += [ ( ‘var%d(t-%d)’ % ( j + 1 , i ) ) for j in range ( n_vars ) ]
# forecast sequence (t, t+1, … t+n)
for i in range ( 0 , n_out ) :
cols . append ( df . shift ( – i ) )
if i == 0 :
names += [ ( ‘var%d(t)’ % ( j + 1 ) ) for j in range ( n_vars ) ]
else :
names += [ ( ‘var%d(t+%d)’ % ( j + 1 , i ) ) for j in range ( n_vars ) ]
# put it all together
agg = concat ( cols , axis = 1 )
agg . columns = names
# drop rows with NaN values
if dropnan :
agg . dropna ( inplace = True )
return agg
values = [ x for x in range ( 10 ) ]
data = series_to_supervised ( values , 3 )
print ( data )
|
Again, running the example prints the reframed series. We can see that the input sequence is in the correct left-to-right order with the output variable to be predicted on the far right.
|
|
var1(t-3) var1(t-2) var1(t-1) var1(t)
3 0.0 1.0 2.0 3
4 1.0 2.0 3.0 4
5 2.0 3.0 4.0 5
6 3.0 4.0 5.0 6
7 4.0 5.0 6.0 7
8 5.0 6.0 7.0 8
9 6.0 7.0 8.0 9
|
Multi-Step or Sequence Forecasting
A different type of forecasting problem is using past observations to forecast a sequence of future observations.
This may be called sequence forecasting or multi-step forecasting.
We can frame a time series for sequence forecasting by specifying another argument. For example, we could frame a forecast problem with an input sequence of 2 past observations to forecast 2 future observations as follows:
|
|
data = series_to_supervised ( values , 2 , 2 )
|
The complete example is listed below:
1
2
3
4
5
6
7
8
9
10
11
12
13
14
15
16
17
18
19
20
21
22
23
24
25
26
27
28
29
30
31
32
33
34
35
36
37
38
39
40
|
from pandas import DataFrame
from pandas import concat
def series_to_supervised ( data , n_in = 1 , n_out = 1 , dropnan = True ) :
“” “
Frame a time series as a supervised learning dataset.
Arguments:
data: Sequence of observations as a list or NumPy array.
n_in: Number of lag observations as input (X).
n_out: Number of observations as output (y).
dropnan: Boolean whether or not to drop rows with NaN values.
Returns:
Pandas DataFrame of series framed for supervised learning.
“ “”
n_vars = 1 if type ( data ) is list else data . shape [ 1 ]
df = DataFrame ( data )
cols , names = list ( ) , list ( )
# input sequence (t-n, … t-1)
for i in range ( n_in , 0 , – 1 ) :
cols . append ( df . shift ( i ) )
names += [ ( ‘var%d(t-%d)’ % ( j + 1 , i ) ) for j in range ( n_vars ) ]
# forecast sequence (t, t+1, … t+n)
for i in range ( 0 , n_out ) :
cols . append ( df . shift ( – i ) )
if i == 0 :
names += [ ( ‘var%d(t)’ % ( j + 1 ) ) for j in range ( n_vars ) ]
else :
names += [ ( ‘var%d(t+%d)’ % ( j + 1 , i ) ) for j in range ( n_vars ) ]
# put it all together
agg = concat ( cols , axis = 1 )
agg . columns = names
# drop rows with NaN values
if dropnan :
agg . dropna ( inplace = True )
return agg
values = [ x for x in range ( 10 ) ]
data = series_to_supervised ( values , 2 , 2 )
print ( data )
|
Running the example shows the differentiation of input (t-n) and output (t+n) variables with the current observation (t) considered an output.
|
|
var1(t-2) var1(t-1) var1(t) var1(t+1)
2 0.0 1.0 2 3.0
3 1.0 2.0 3 4.0
4 2.0 3.0 4 5.0
5 3.0 4.0 5 6.0
6 4.0 5.0 6 7.0
7 5.0 6.0 7 8.0
8 6.0 7.0 8 9.0
|
Multivariate Forecasting
Another important type of time series is called multivariate time series.
This is where we may have observations of multiple different measures and an interest in forecasting one or more of them.
For example, we may have two sets of time series observations obs1 and obs2 and we wish to forecast one or both of these.
We can call series_to_supervised() in exactly the same way.
For example:
1
2
3
4
5
6
7
8
9
10
11
12
13
14
15
16
17
18
19
20
21
22
23
24
25
26
27
28
29
30
31
32
33
34
35
36
37
38
39
40
41
42
43
|
from pandas import DataFrame
from pandas import concat
def series_to_supervised ( data , n_in = 1 , n_out = 1 , dropnan = True ) :
“” “
Frame a time series as a supervised learning dataset.
Arguments:
data: Sequence of observations as a list or NumPy array.
n_in: Number of lag observations as input (X).
n_out: Number of observations as output (y).
dropnan: Boolean whether or not to drop rows with NaN values.
Returns:
Pandas DataFrame of series framed for supervised learning.
“ “”
n_vars = 1 if type ( data ) is list else data . shape [ 1 ]
df = DataFrame ( data )
cols , names = list ( ) , list ( )
# input sequence (t-n, … t-1)
for i in range ( n_in , 0 , – 1 ) :
cols . append ( df . shift ( i ) )
names += [ ( ‘var%d(t-%d)’ % ( j + 1 , i ) ) for j in range ( n_vars ) ]
# forecast sequence (t, t+1, … t+n)
for i in range ( 0 , n_out ) :
cols . append ( df . shift ( – i ) )
if i == 0 :
names += [ ( ‘var%d(t)’ % ( j + 1 ) ) for j in range ( n_vars ) ]
else :
names += [ ( ‘var%d(t+%d)’ % ( j + 1 , i ) ) for j in range ( n_vars ) ]
# put it all together
agg = concat ( cols , axis = 1 )
agg . columns = names
# drop rows with NaN values
if dropnan :
agg . dropna ( inplace = True )
return agg
raw = DataFrame ( )
raw [ ‘ob1’ ] = [ x for x in range ( 10 ) ]
raw [ ‘ob2’ ] = [ x for x in range ( 50 , 60 ) ]
values = raw . values
data = series_to_supervised ( values )
print ( data )
|
Running the example prints the new framing of the data, showing an input pattern with one time step for both variables and an output pattern of one time step for both variables.
Again, depending on the specifics of the problem, the division of columns into X and Y components can be chosen arbitrarily, such as if the current observation of var1 was also provided as input and only var2was to be predicted.
|
|
var1(t-1) var2(t-1) var1(t) var2(t)
1 0.0 50.0 1 51
2 1.0 51.0 2 52
3 2.0 52.0 3 53
4 3.0 53.0 4 54
5 4.0 54.0 5 55
6 5.0 55.0 6 56
7 6.0 56.0 7 57
8 7.0 57.0 8 58
9 8.0 58.0 9 59
|
You can see how this may be easily used for sequence forecasting with multivariate time series by specifying the length of the input and output sequences as above.
For example, below is an example of a reframing with 1 time step as input and 2 time steps as forecast sequence.
1
2
3
4
5
6
7
8
9
10
11
12
13
14
15
16
17
18
19
20
21
22
23
24
25
26
27
28
29
30
31
32
33
34
35
36
37
38
39
40
41
42
43
|
from pandas import DataFrame
from pandas import concat
def series_to_supervised ( data , n_in = 1 , n_out = 1 , dropnan = True ) :
“” “
Frame a time series as a supervised learning dataset.
Arguments:
data: Sequence of observations as a list or NumPy array.
n_in: Number of lag observations as input (X).
n_out: Number of observations as output (y).
dropnan: Boolean whether or not to drop rows with NaN values.
Returns:
Pandas DataFrame of series framed for supervised learning.
“ “”
n_vars = 1 if type ( data ) is list else data . shape [ 1 ]
df = DataFrame ( data )
cols , names = list ( ) , list ( )
# input sequence (t-n, … t-1)
for i in range ( n_in , 0 , – 1 ) :
cols . append ( df . shift ( i ) )
names += [ ( ‘var%d(t-%d)’ % ( j + 1 , i ) ) for j in range ( n_vars ) ]
# forecast sequence (t, t+1, … t+n)
for i in range ( 0 , n_out ) :
cols . append ( df . shift ( – i ) )
if i == 0 :
names += [ ( ‘var%d(t)’ % ( j + 1 ) ) for j in range ( n_vars ) ]
else :
names += [ ( ‘var%d(t+%d)’ % ( j + 1 , i ) ) for j in range ( n_vars ) ]
# put it all together
agg = concat ( cols , axis = 1 )
agg . columns = names
# drop rows with NaN values
if dropnan :
agg . dropna ( inplace = True )
return agg
raw = DataFrame ( )
raw [ ‘ob1’ ] = [ x for x in range ( 10 ) ]
raw [ ‘ob2’ ] = [ x for x in range ( 50 , 60 ) ]
values = raw . values
data = series_to_supervised ( values , 1 , 2 )
print ( data )
|
Running the example shows the large reframed DataFrame.
|
|
var1(t-1) var2(t-1) var1(t) var2(t) var1(t+1) var2(t+1)
1 0.0 50.0 1 51 2.0 52.0
2 1.0 51.0 2 52 3.0 53.0
3 2.0 52.0 3 53 4.0 54.0
4 3.0 53.0 4 54 5.0 55.0
5 4.0 54.0 5 55 6.0 56.0
6 5.0 55.0 6 56 7.0 57.0
7 6.0 56.0 7 57 8.0 58.0
8 7.0 57.0 8 58 9.0 59.0
|
Experiment with your own dataset and try multiple different framings to see what works best.
Summary
In this tutorial, you discovered how to reframe time series datasets as supervised learning problems with Python.
Specifically, you learned:
- About the Pandas shift() function and how it can be used to automatically define supervised learning datasets from time series data.
- How to reframe a univariate time series into one-step and multi-step supervised learning problems.
- How to reframe multivariate time series into one-step and multi-step supervised learning problems.
Do you have any questions?
Ask your questions in the comments below and I will do my best to answer.
时间序列
MUEEN KEOGH算法
SEPTEMBER 15, 2017
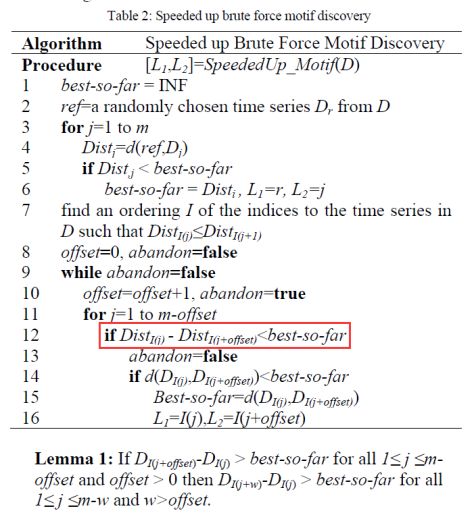
论文:Exact Discovery of Time Series Motifs
Speeded up Brute Force Motif Discovery:
Github:https://github.com/saifuddin778/mkalgo
但是感觉有一行比较奇怪,应该是  ,而不是
,而不是 ,因为
,因为  是递增排列的,并且 best-so-far > 0.
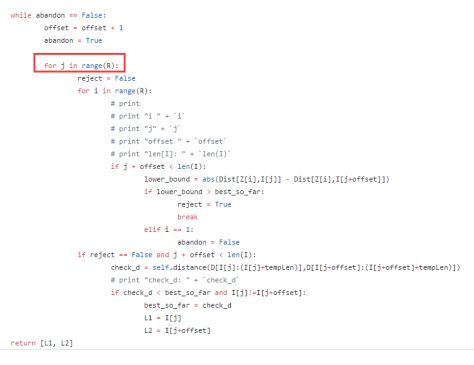
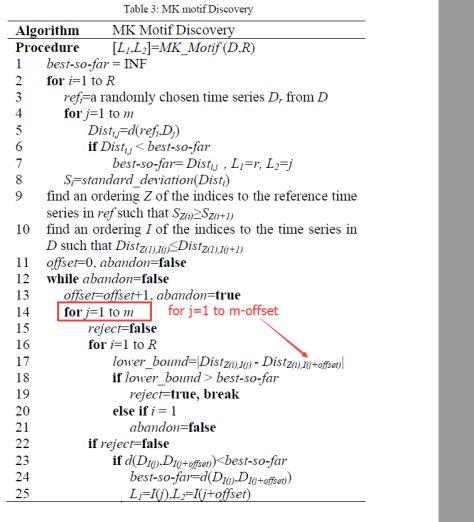
Generalization to multiple reference points:
https://github.com/nicholasg3/motif-mining/tree/95bbb05ac5d0f9e90134a67a789ea7e607f22cea
注意:
for j = 1 to m-offset 而不是 for j = 1 to R
Time Series Clustering with Dynamic Time Warping (DTW)
https://github.com/goodmattg/wikipedia_kaggle
![]() ,
,![]() 。按照其递归公式来计算,我们可以详细写出前面的几项,那就是:
。按照其递归公式来计算,我们可以详细写出前面的几项,那就是:![]() 的矩阵 A 能够对角化,那就是存在可逆矩阵 P 使得
的矩阵 A 能够对角化,那就是存在可逆矩阵 P 使得![]()
![]()
![]()
![]() 表示一个
表示一个 ![]() 的对角矩阵,其对角的元素从左上角到右下角依次是
的对角矩阵,其对角的元素从左上角到右下角依次是 ![]() 。如果把矩阵 P 写成列向量的形式,i.e.
。如果把矩阵 P 写成列向量的形式,i.e. ![]() ,那么以上的矩阵方程就可以转换为
,那么以上的矩阵方程就可以转换为 ![]() ,
, ![]() 。进一步来说,如果要计算矩阵 A 的幂,就可以得到:
。进一步来说,如果要计算矩阵 A 的幂,就可以得到:![]()
![]() 的多项式的解,
的多项式的解,![]()
![]() 和
和 ![]() ,它们所对应的特征向量分别是:
,它们所对应的特征向量分别是:![]() .
.![]() 具有弱平稳性(Weak Stationary)指的是:
具有弱平稳性(Weak Stationary)指的是: 对于所有的
对于所有的  都是恒定的;
 对于所有的
对于所有的  都是恒定的;
 与
与  的协方差对于所有的
  都是恒定的。
![]() ,可以定义 ACF 为
,可以定义 ACF 为![]() 在弱平稳性的假定下,ACF 将会简化为
在弱平稳性的假定下,ACF 将会简化为![]() .
.![]() 在时间戳
在时间戳 ![]() 时刻的取值
时刻的取值 ![]() 与时间戳
与时间戳 ![]() 时刻的取值
时刻的取值 ![]() 相关,其公式就是:
相关,其公式就是:![]() ,
,![]() 满足如下条件:
满足如下条件: ,并且
,并且  满足 iid 条件。其中
  表示 Gauss 正态分布,它的均值是0,方差是
  。
。 与
与  是相互独立的(independent)。
 是弱平稳的,i.e. 必须满足
  。
。![]() ,则可以得到一些 AR(1) 模型的例子如下图所示:
,则可以得到一些 AR(1) 模型的例子如下图所示: .
. .
. .
.![]() ,
,![]() .
.![]()
![]() ,
,![]() .
.![]() . 从
. 从 ![]() 的定义出发,可以得到:
的定义出发,可以得到:![]()
![]()
![]() .
.![]() 恒等于零,就可以得到
恒等于零,就可以得到 ![]() 对于所有的
对于所有的 ![]() 都成立。也就是可以写成一个一维函数的迭代公式:
都成立。也就是可以写成一个一维函数的迭代公式:![]()
![]() 的收敛性,这里的
的收敛性,这里的 ![]() 表示函数
表示函数 ![]() 的
的 ![]() 次迭代。
次迭代。![]() 的定义直接计算可以得到:
的定义直接计算可以得到:![]() ,
,![]() ,可以得到
,可以得到 ![]() 。这与
。这与 ![]() 其实是保持一致的。
其实是保持一致的。![]() ,可以从公式上得到
,可以从公式上得到 ![]() 当
当 ![]() 。
。![]() ,那么
,那么![]()
![]()
![]() ,我们可以得到
,我们可以得到 ![]() . i.e.
. i.e. ![]() 趋近于
趋近于 ![]() .
.![]() ,很容易得到
,很容易得到![]()
![]()
![]() 这种条件下,
这种条件下,![]() as
as ![]() . 特别地,对于一阶差分方程
. 特别地,对于一阶差分方程 ![]() 而言,如果
而言,如果 ![]() ,那么
,那么 ![]() 的取值会越来越大,这与现实的状况不相符,所以在时间序列的研究中,一般都会假设
的取值会越来越大,这与现实的状况不相符,所以在时间序列的研究中,一般都会假设 ![]() 。
。![]()
![]()
![]()
![]() 并且忽略误差项,因此可以得到简化版的模型形如:
并且忽略误差项,因此可以得到简化版的模型形如:![]() .
.![]() ,求解可以得到
,求解可以得到 ![]() ,i.e.
,i.e. ![]() 。当
。当 ![]() 都在单位圆内部的时候,也就是该模型
都在单位圆内部的时候,也就是该模型 ![]() 满足稳定性的条件。
满足稳定性的条件。![]()
![]() ,可以得到其特征多项式为:
,可以得到其特征多项式为:![]()
![]() ,该 p 阶差分方程
,该 p 阶差分方程![]()

