excel迷你图 vba
Do you use the sparklines that were introduced in Excel 2010? Last week, I was building a dashboard, and wanted to show sparklines for expenses and revenue.
您是否使用Excel 2010中引入的迷你图? 上周,我正在构建一个仪表板,并希望显示支出和收入的迷你图。
It didn't go smoothly at first, but I finally got things working, and then I ran into another hurdle! Here's what went wrong, and how I fixed things.
起初进展并不顺利,但是我终于使事情正常了,然后又遇到了另一个障碍! 这是哪里出了问题,以及我如何解决问题。
创建迷你图组 (Create a Sparkline Group)
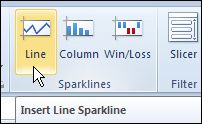
In this example, I had expenses and revenue in alternating columns, and I wanted expense sparklines in cells C4:C14. So, I selected those cells, and on the Ribbon's Insert tab, click the Line command in Sparklines.
在此示例中,我在交替列中有费用和收入,并且我希望在单元格C4:C14中有费用迷你图。 因此,我选择了这些单元格,然后在功能区的“插入”选项卡上,单击迷你图中的“线”命令。
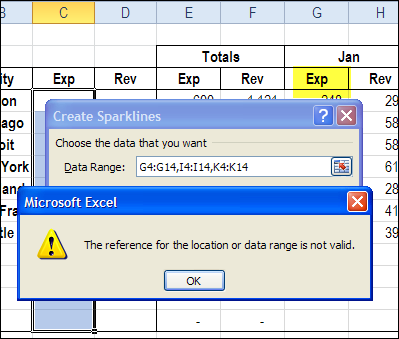
In the Create Sparklines dialog box, I selected the first range of expense cells, then pressed the Ctrl key, and selected the other two ranges.
在“创建迷你图”对话框中,我选择了第一个费用单元格范围,然后按了Ctrl键,然后选择了其他两个范围。
When I clicked OK, an error message appeared -- "The reference for the location or data range is not valid."
当我单击“确定”时,出现一条错误消息-“位置或数据范围的引用无效。”
Apparently the sparklines need a contiguous range, and won't work with non-contiguous ranges.
显然,迷你图线需要一个连续的范围,而不适用于非连续的范围。
为迷你图创建数据 (Create Data for the Sparklines)
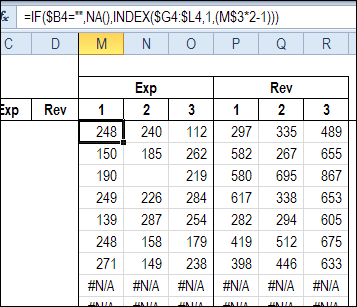
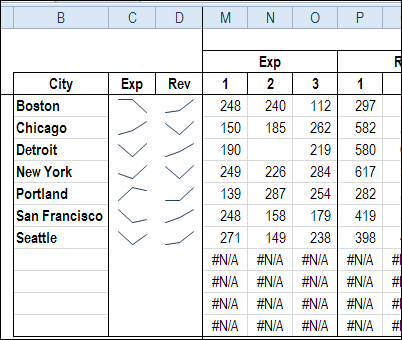
To create a contiguous range of data that the sparklines could use, I set up Expense and Revenue sections to the right of the existing data.
为了创建迷你图可以使用的连续数据范围,我在现有数据的右侧设置了“支出”和“收入”部分。
Then, I used formulas to link to the existing data, and show an NA if there was no city name in column B.
然后,我使用公式链接到现有数据,并在B列中没有城市名称的情况下显示NA。
=IF($B4="",NA(),INDEX($G4:$L4,1,(M$3*2-1)))
= IF($ B4 =“”,NA(),INDEX($ G4:$ L4,1,(M $ 3 * 2-1)))
创建迷你图 (Create the Sparklines)
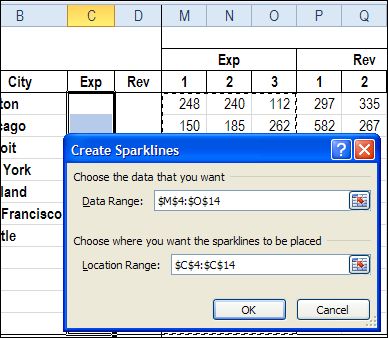
Next, I selected the cells where the sparklines should appear, and selected the Expense data in the linked range.
接下来,我选择了出现迷你图的单元格,并在链接的范围内选择了费用数据。
That worked perfectly! I then set up the Revenue sparklines in column D.
效果很好! 然后,我在D列中设置了收入迷你图。
隐藏迷你图数据 (Hide the Sparkline Data)
Once the sparklines were set up, I decided to clean up the sheet, so I hid the columns with the sparkline data. Unfortunately, the sparklines disappeared too!
设置样条线后,我决定清理工作表,因此我将样条线数据隐藏在列中。 不幸的是,迷你图也消失了!
Regular Excel charts have a setting that you can change, to show hidden data, so I figured that Sparklines must have a similar setting.
常规Excel图表的设置可以更改,以显示隐藏数据 ,因此我认为迷你图必须具有类似的设置。
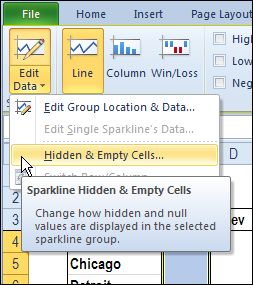
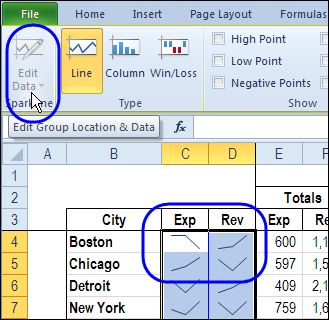
I selected the Expense sparkline group, and on the Ribbon, under Sparkline Tools, clicked Edit Data.
我选择了“支出”迷你图组,然后在“功能区”上的“迷你图工具”下,单击“编辑数据”。
There was a Hidden & Empty Cells command, which sounded promising, so I clicked that.
有一个“隐藏和空单元格”命令,听起来很有希望,所以我单击了它。
In the Hidden and Empty Cell Settings dialog box, I clicked Show Data in Hidden Rows and Columns, to add a check mark, and clicked OK.
在“隐藏和空单元格设置”对话框中,单击“在隐藏的行和列中显示数据”以添加复选标记,然后单击“确定”。
Hurray! The Expense sparkline group reappeared.
欢呼! 费用迷你图组重新出现。
更改多个迷你图组 (Change Multiple Sparkline Groups)
Next, I had to change the Revenue sparkline group settings, so I selected those cells. In Excel, you can press the F4 key to repeat the last action, but that doesn't work for sparkline settings, apparently. So, I had to follow the same steps to open the dialog box, and change the Revenue sparkline settings.
接下来,我必须更改“收入”迷你图组设置,因此选择了这些单元格。 在Excel中,您可以按F4键重复上一个操作,但是显然,这对于迷你图设置无效。 因此,我必须按照相同的步骤打开对话框,并更改“收入”迷你图设置。
In the example shown here, there are only two sparkline groups, but in my actual file there were about 20 groups. I tried selecting two sparkline groups, to change their settings at the same time, but the Edit Data command isn't available in that situation.
在此处显示的示例中,只有两个迷你图组,但是在我的实际文件中,大约有20个组。 我尝试选择两个迷你图组,以同时更改它们的设置,但是在这种情况下,“编辑数据”命令不可用。
So, I decided to write a macro that would change all the sparkline groups on the active sheet. The code worked really well, and it should come in handy if I create sparklines in a different workbook. And I hope it helps you too!
因此,我决定编写一个宏,该宏将更改活动工作表上的所有迷你图组。 该代码非常有效,如果我在其他工作簿中创建迷你图,它应该会派上用场。 我希望它也对您有帮助!
Sub SparklinesFix()
Dim spk As SparklineGroup
For Each spk In ActiveSheet.Cells.SparklineGroups
    spk.DisplayBlanksAs = xlNotPlotted
    spk.DisplayHidden = True
Next spk
End Sub
下载样本文件 (Download the Sample File)
To download the sample file, please visit the Excel Templates page on my Contextures website. In the Charts section, look for CH0007 – Show Sparklines for Hidden Data. The file will work in Excel 2010, but sparklines are not available in earlier versions.
要下载示例文件,请访问我的Contextures网站上的Excel模板页面。 在“图表”部分中 ,查找“ CH0007 – 显示隐藏数据的迷你图”。 该文件将在Excel 2010中工作,但迷你图在早期版本中不可用。
翻译自: https://contexturesblog.com/archives/2012/11/20/show-excel-sparklines-for-hidden-data/
excel迷你图 vba
