Python自动化办公--Pandas玩转Excel数据分析【二】
相关文章:
Python自动化办公--Pandas玩转Excel【一】
Python自动化办公--Pandas玩转Excel数据分析【三】
python处理Excel实现自动化办公教学(含实战)【一】
python处理Excel实现自动化办公教学(含实战)【二】
python处理Excel实现自动化办公教学(数据筛选、公式操作、单元格拆分合并、冻结窗口、图表绘制等)【三】
python入门之后须掌握的知识点(模块化编程、时间模块)【一】
python入门之后须掌握的知识点(excel文件处理+邮件发送+实战:批量化发工资条)【二】
相关码源
pandas玩转excel码源.zip-数据挖掘文档类资源-CSDN下载
1.多表联合
merge 和join区别:
join没有:left_on right_on
import pandas as pd

students = pd.read_excel('Student_score.xlsx',
                         sheet_name='Students')  # 此处ID未被设置成index
scores = pd.read_excel('Student_score.xlsx', sheet_name='Scores')
table = students.merge(scores, how='left', on='ID').fillna(
    0)  # how='left'无论条件是否成立左边数据表都要保存
# left_on right_on
table.Score = table.Score.astype(int)
print(table)


# 此处ID被设置成index两种方法
# students = pd.read_excel('Student_score.xlsx', sheet_name='Students', index_col='ID')
# scores = pd.read_excel('Student_score.xlsx', sheet_name='Scores', index_col='ID')
# table = students.merge(scores, how='left', left_on=students.index, right_on=scores.index).fillna(0)
# table.Score = table.Score.astype(int)
# print(table)

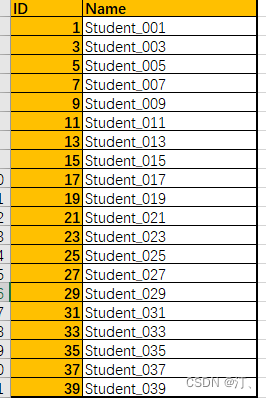
students = pd.read_excel('Student_score.xlsx',
                         sheet_name='Students', index_col='ID')
scores = pd.read_excel('Student_score.xlsx',
                       sheet_name='Scores', index_col='ID')
table = students.join(scores, how='left').fillna(0)
table.Score = table.Score.astype(int)
print(table)
      Name  Score
ID
1   Student_001     81
3   Student_003     83
5   Student_005     85
7   Student_007     87
9   Student_009     89
11  Student_011     91
13  Student_013     93
15  Student_015     95
17  Student_017     97
19  Student_019     99
21  Student_021      0
23  Student_023      0
25  Student_025      0
27  Student_027      0
29  Student_029      0
31  Student_031      0
33  Student_033      0
35  Student_035      0
37  Student_037      0
39  Student_039      0
通常情况mysql用的比较多,可以考虑和python联用,可以参考我的MySQL专栏
2. 数据校验,轴的概念
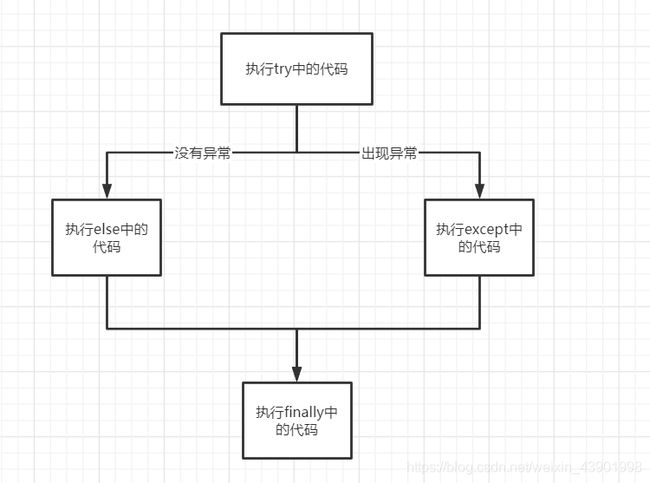
python会捕获到try中的异常,并且当try中某一行出现异常后,后面的代码将不会再被执行;而是直接调用except中的代码
try...except语句的执行流程非常简单,可分为两步:
- 执行try语句中的代码,如果出现异常,Python会得到异常的类型
- Python将出现的异常类型和except语句中的异常类型做对比,调用对应except语句中的代码块
else的功能:当try中的代码没有异常时,会调用else中的代码。
try...except..else的使用和try...except相同,只不过多了else代码,else中的代码只有当try中的代码块没有发现异常的时候才会调用。- else中的代码只有当try中的代码没有出现异常时才会被执行;并且else要和try…except配合使用,如果使用了else,则代码中不能没有except,否则会报错
finally的功能:不管try中的代码是否有异常,最终都会调用finally中的代码
- finally可以结合
try...except,try...except...else使用,也可以仅有try和finally。
Python assert(断言)用于判断一个表达式,在表达式条件为 false 的时候触发异常。
断言可以在条件不满足程序运行的情况下直接返回错误,而不必等待程序运行后出现崩溃的情况,例如我们的代码只能在 Linux 系统下运行,可以先判断当前系统是否符合条件。
import pandas as pd


def score_valication(row):
    try:
        assert 0 <= row.Score <= 100
    except:
        print(f'#{row.ID}\tstudent {row.Name} has an invalid score {row.Score}')


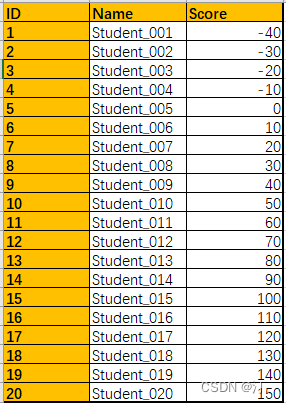
students = pd.read_excel('Students4.xlsx')
# print(students)
students.apply(score_valication, axis=1)
#1 student Student_001 has an invalid score -40
#2 student Student_002 has an invalid score -30
#3 student Student_003 has an invalid score -20
#4 student Student_004 has an invalid score -10
#16 student Student_016 has an invalid score 110
#17 student Student_017 has an invalid score 120
#18 student Student_018 has an invalid score 130
#19 student Student_019 has an invalid score 140
#20 student Student_020 has an invalid score 1503.把一列数据分割成两列
进行分割:
split()函数讲解:
split`(*self*, *pat=None*, *n=-1*, *expand=False*)
pat:分列的依据,可以是空格,符号,字符串等等。默认为空格 “ ” ; “,”
n:分列的次数,不指定的话就会根据符号的个数全部分列。n=-1 or 0 全部保留
expand:为True可以直接将分列后的结果转换成DataFrame。
如果想要从最右边开始分列,可以使用rsplit(),rsplit()和split()的用法类似,一个从右边开始,一个从左边开始。
import pandas as pd

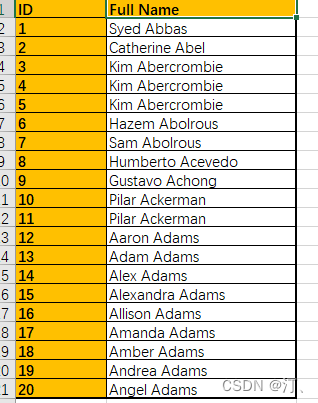
employees = pd.read_excel('Employees.xlsx', index_col='ID')
df = employees['Full Name'].str.split(expand=True)
# df = employees['Full Name'].str.split(expand=False)
print(df)
employees['First Name'] = df[0]
employees['Last Name'] = df[1]
#employees['Last Name'] = df[1].str.upper() 全变成大写,相关函数可以查询字符串功能
print(employees)
ID
1           [Syed, Abbas]
2       [Catherine, Abel]
3      [Kim, Abercrombie]
4      [Kim, Abercrombie]
5      [Kim, Abercrombie]
6       [Hazem, Abolrous]
7         [Sam, Abolrous]
8     [Humberto, Acevedo]
9       [Gustavo, Achong]
10      [Pilar, Ackerman]
11      [Pilar, Ackerman]
12         [Aaron, Adams]
13          [Adam, Adams]
14          [Alex, Adams]
15     [Alexandra, Adams]
16       [Allison, Adams]
17        [Amanda, Adams]
18         [Amber, Adams]
19        [Andrea, Adams]
20         [Angel, Adams]

df = employees['Full Name'].str.split(expand=True)
            0            1
ID
1        Syed        Abbas
2   Catherine         Abel
3         Kim  Abercrombie
4         Kim  Abercrombie
5         Kim  Abercrombie
6       Hazem     Abolrous
7         Sam     Abolrous
8    Humberto      Acevedo
9     Gustavo       Achong
10      Pilar     Ackerman
11      Pilar     Ackerman
12      Aaron        Adams
13       Adam        Adams
14       Alex        Adams
15  Alexandra        Adams
16    Allison        Adams
17     Amanda        Adams
18      Amber        Adams
19     Andrea        Adams
20      Angel        Adams
Full Name First Name Last Name
ID
1 Syed Abbas Syed Abbas
2 Catherine Abel Catherine Abel
3 Kim Abercrombie Kim Abercrombie
4 Kim Abercrombie Kim Abercrombie
5 Kim Abercrombie Kim Abercrombie
6 Hazem Abolrous Hazem Abolrous
7 Sam Abolrous Sam Abolrous
8 Humberto Acevedo Humberto Acevedo
9 Gustavo Achong Gustavo Achong
10 Pilar Ackerman Pilar Ackerman
11 Pilar Ackerman Pilar Ackerman
12 Aaron Adams Aaron Adams
13 Adam Adams Adam Adams
14 Alex Adams Alex Adams
15 Alexandra Adams Alexandra Adams
16 Allison Adams Allison Adams
17 Amanda Adams Amanda Adams
18 Amber Adams Amber Adams
19 Andrea Adams Andrea Adams
20 Angel Adams Angel Adams4.求和求平均!等统计
import pandas as pd

students = pd.read_excel('Students5.xlsx', index_col='ID')

row_sum = students[['Test_1', 'Test_2', 'Test_3']].sum(axis=1) #拿到子集求和。默认sum是axis=0
row_mean = students[['Test_1', 'Test_2', 'Test_3']].mean(axis=1)

students['Total'] = row_sum
students['Average'] = row_mean

col_mean = students[['Test_1', 'Test_2', 'Test_3', 'Total', 'Average']].mean()#所有列的平均值
print(col_mean)
col_mean['Name'] = 'Summary'#进行命名
students = students.append(col_mean, ignore_index=True)#增加一行,向量拼接
print(students)
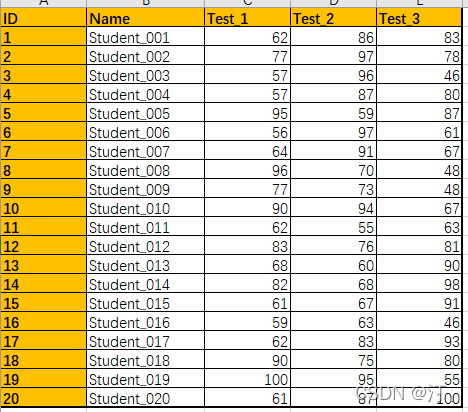
Test_1 72.95
Test_2 78.95
Test_3 73.10
Total 225.00
Average 75.00
dtype: float64
Name Test_1 Test_2 Test_3 Total Average
0 Student_001 62.00 86.00 83.0 231.0 77.000000
1 Student_002 77.00 97.00 78.0 252.0 84.000000
2 Student_003 57.00 96.00 46.0 199.0 66.333333
3 Student_004 57.00 87.00 80.0 224.0 74.666667
4 Student_005 95.00 59.00 87.0 241.0 80.333333
5 Student_006 56.00 97.00 61.0 214.0 71.333333
6 Student_007 64.00 91.00 67.0 222.0 74.000000
7 Student_008 96.00 70.00 48.0 214.0 71.333333
8 Student_009 77.00 73.00 48.0 198.0 66.000000
9 Student_010 90.00 94.00 67.0 251.0 83.666667
10 Student_011 62.00 55.00 63.0 180.0 60.000000
11 Student_012 83.00 76.00 81.0 240.0 80.000000
12 Student_013 68.00 60.00 90.0 218.0 72.666667
13 Student_014 82.00 68.00 98.0 248.0 82.666667
14 Student_015 61.00 67.00 91.0 219.0 73.000000
15 Student_016 59.00 63.00 46.0 168.0 56.000000
16 Student_017 62.00 83.00 93.0 238.0 79.333333
17 Student_018 90.00 75.00 80.0 245.0 81.666667
18 Student_019 100.00 95.00 55.0 250.0 83.333333
19 Student_020 61.00 87.00 100.0 248.0 82.666667
20 Summary 72.95 78.95 73.1 225.0 75.0000005.定位、消除重复数据
df.duplicated(subset=None, keep=‘first’) # 指定列数据重复项判断;
# 返回:指定列重复行boolean Series
df.drop_duplicates(subset=None, keep=‘first’, # 删除重复数据
inplace=False) # 返回:副本或替代参数:
subset=None:列标签或标签序列,可选# 只考虑某些列来识别重复项;默认使用所有列
keep=‘first’:{‘first’,‘last’,False}
# - first:将第一次出现重复值标记为True
# - last:将最后一次出现重复值标记为True
# - False:将所有重复项标记为True
import pandas as pd

students = pd.read_excel('Students_Duplicates.xlsx')
dupe = students.duplicated(subset='Name')
#多列
# dupe = students.duplicated(subset=['Name',"ID"])
print(dupe.any())#判断有没有重复,有返回true
dupe = dupe[dupe == True]  # 过滤,筛选出重复值,dupe = dupe[dupe]
print(students.iloc[dupe.index]) #定位得到重复数据
print("=========")
students.drop_duplicates(subset='Name', inplace=True, keep='last') #保存最后一次的,前面重复的删除
print(students)

# keep=‘first’:{‘first’,‘last’,False}
# - first:将第一次出现重复值标记为True
# - last:将最后一次出现重复值标记为True
# - False:将所有重复项标记为True
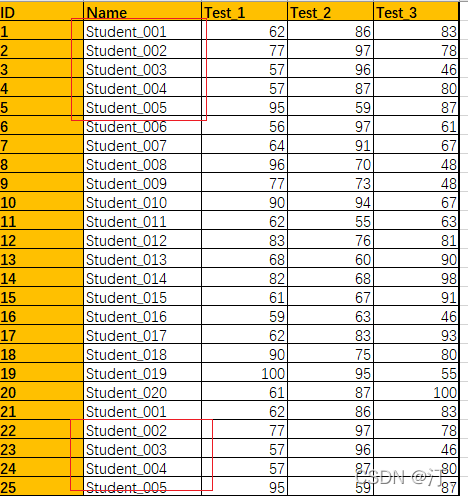
True
ID Name Test_1 Test_2 Test_3
20 21 Student_001 62 86 83
21 22 Student_002 77 97 78
22 23 Student_003 57 96 46
23 24 Student_004 57 87 80
24 25 Student_005 95 59 87
=========
ID Name Test_1 Test_2 Test_3
5 6 Student_006 56 97 61
6 7 Student_007 64 91 67
7 8 Student_008 96 70 48
8 9 Student_009 77 73 48
9 10 Student_010 90 94 67
10 11 Student_011 62 55 63
11 12 Student_012 83 76 81
12 13 Student_013 68 60 90
13 14 Student_014 82 68 98
14 15 Student_015 61 67 91
15 16 Student_016 59 63 46
16 17 Student_017 62 83 93
17 18 Student_018 90 75 80
18 19 Student_019 100 95 55
19 20 Student_020 61 87 100
20 21 Student_001 62 86 83
21 22 Student_002 77 97 78
22 23 Student_003 57 96 46
23 24 Student_004 57 87 80
24 25 Student_005 95 59 876.旋转数据表(行&转换)---转置
import pandas as pd

pd.options.display.max_columns = 999
videos = pd.read_excel('Videos.xlsx', index_col='Month')
table = videos.transpose()#转置
print(table)

table = videos.T #简单写法
print(table)
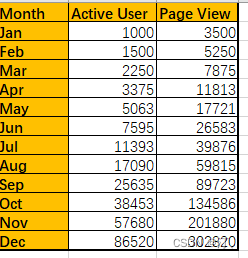
Month Jan Feb Mar Apr May Jun Jul Aug Sep \
Active User 1000 1500 2250 3375 5063 7595 11393 17090 25635
Page View 3500 5250 7875 11813 17721 26583 39876 59815 89723
Month Oct Nov Dec
Active User 38453 57680 86520
Page View 134586 201880 3028207.读取CSV、TSV、TXT中数据
import pandas as pd


students1 = pd.read_csv('Students.csv', index_col='ID')
# students2 = pd.read_csv('Students.tsv', sep='\t', index_col='ID') #制表符分割
students3 = pd.read_csv('Students.txt', sep='|', index_col='ID')  #分割符

print(students1)
# print(students2)
print(students3)
           Name  Age
ID
1   Student_001   21
2   Student_002   22
3   Student_003   23
4   Student_004   24
5   Student_005   25
6   Student_006   26
7   Student_007   27
8   Student_008   28
9   Student_009   29
10  Student_010   30
11  Student_011   31
12  Student_012   32
13  Student_013   33
14  Student_014   34
15  Student_015   35
16  Student_016   36
17  Student_017   37
18  Student_018   38
19  Student_019   39
20  Student_020   40
8.透视表!!、分组、聚合
import pandas as pd
from datetime import date
import numpy as np

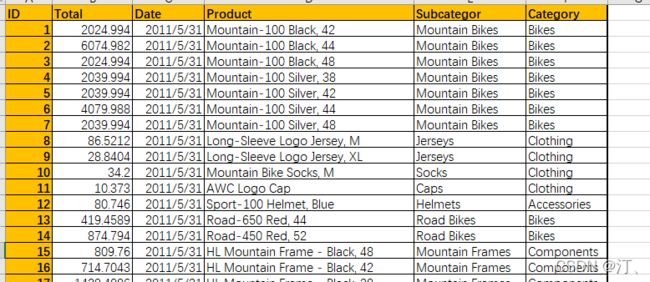
orders = pd.read_excel('Orders1.xlsx', dtype={'Date': date})
orders['Year'] = pd.DatetimeIndex(orders.Date).year #以年份去做透视表
groups = orders.groupby(['Category', 'Year'])
s = groups['Total'].sum()
c = groups['ID'].count()
pt1 = pd.DataFrame({'Sum': s, 'Count': c})
#两种方法做透视表
pt2 = orders.pivot_table(index='Category', columns='Year', values='Total',
      aggfunc=np.sum)#聚合方式

print(pt1)
print(pt2)
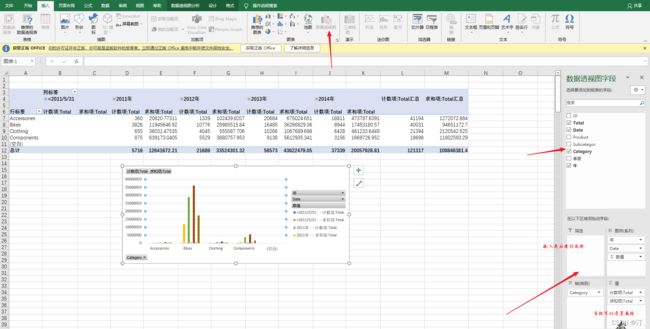
Sum Count
Category Year
Accessories 2011 2.082077e+04 360
2012 1.024398e+05 1339
2013 6.750247e+05 20684
2014 4.737876e+05 18811
Bikes 2011 1.194565e+07 3826
2012 2.898552e+07 10776
2013 3.626683e+07 16485
2014 1.745318e+07 8944
Clothing 2011 3.603148e+04 655
2012 5.555877e+05 4045
2013 1.067690e+06 10266
2014 4.612336e+05 6428
Components 2011 6.391730e+05 875
2012 3.880758e+06 5529
2013 5.612935e+06 9138
2014 1.669727e+06 3156
Year 2011 2012 2013 2014
Category
Accessories 2.082077e+04 1.024398e+05 6.750247e+05 4.737876e+05
Bikes 1.194565e+07 2.898552e+07 3.626683e+07 1.745318e+07
Clothing 3.603148e+04 5.555877e+05 1.067690e+06 4.612336e+05
Components 6.391730e+05 3.880758e+06 5.612935e+06 1.669727e+06