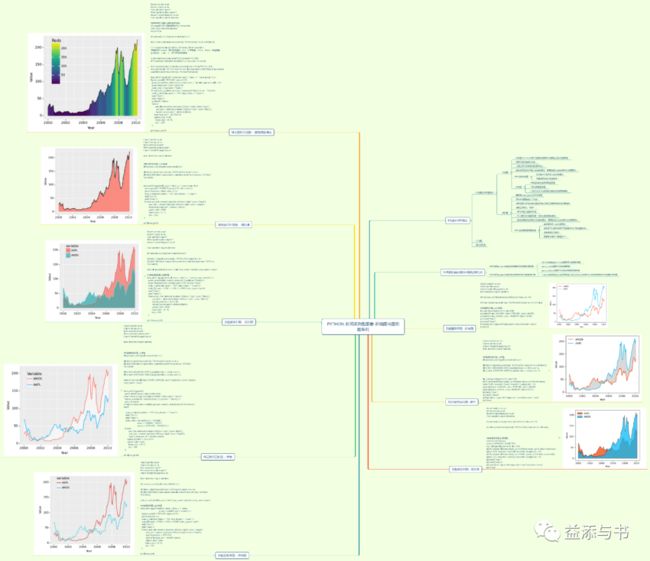
python 折线图_python时间序列型图表折线图和面积图系列
折线图与面积图系列
时间序列型图表
折线图与面积图系列
折线图
面积图
日历图
量化波形图
折线图
折线图(line chart)用于在连续间隔或时间跨度上显示定量数值;
常用来显示趋势和关系;
主要应用于时间系列数据可视化;
能够体现某些时间段内的整体概览,看看数据在这段时间内的发展情况;
绘制折线图
先在笛卡尔坐标系上定出数据点;
用直线把这些点连接起来;
折线图
X轴包括类别型或序数型变量;
分别对应文本坐标轴和序数坐标轴两种类型;
Y轴为数值型变量;
面积图
面积图(area graph)又称区域图
是在折线图基础之上形成;
将折线图中折线与自变量坐标轴之间的区域使用颜色或纹理填充
填充区域称为“面积”;
常用来显示趋势和关系;
可以更好突出趋势信息,同时让图表更加美观;
能够体现某些时间段内的整体概览,看看数据在这段时间内的发展情况;
绘制面积图需要注意
颜色要带有一定的透明度;
透明度可以很好观察不同数据序列之间的重叠关系;
避免数据之间遮挡;
数据系列最好不要超过3个;
颜色映射填充面积图
将折线部分的数据点根据Y值颜色映射到颜色渐变主题;
可以更好促进数据信息表达;
只适用于单数据系列面积图;
两条折线间填充面积图
两条折线之间可以使用面积填充,可以清晰观察数据之间的差异变化;
只适用于双数据系列的数值差异比较展示;
折线图和面积图系列的绘制方法
使用plotnine包绘制多数据系列折线图和面积图
plotnine包的geom_line()函数可以绘制折线图;
geom_area()函数可以绘制面积图;
geom_ribbon()函数可以绘制夹层填充面积图
多数据系列图---折线图
import pandas as pd
import numpy as np
from plotnine import *
#from plotnine.data import *
import matplotlib.pyplot as plt
from datetime import datetime
df=pd.read_csv('d:/python/out/LineD.csv')
df['date']=[datetime.strptime(d, '%Y/%m/%d').date() for d in df['date']]#df['date'].map(lambda x:datetime.datetime.strptime(x, '%Y/%m/%d').date())
melt_df=pd.melt(df,id_vars=["date"],var_name='variable',value_name='value')
#多数据系列图. (a)折线图
base_plot=(ggplot(melt_df, aes(x ='date', y = 'value',
group='variable',color='variable') )+
#geom_area(fill="#FF6B5E",alpha=0.75)+
geom_line(size=1)+
scale_x_date(date_labels = "%Y",date_breaks = "2 year")+
scale_fill_hue(s = 0.90, l = 0.65, h=0.0417,color_space='husl')+
xlab("Year")+
ylab("Value")+
theme( axis_title=element_text(size=10,face="plain",color="black"),
axis_text = element_text(size=10,face="plain",color="black"),
legend_position = (0.25,0.8),
legend_background = element_blank(),
aspect_ratio =0.85,
figure_size = (5, 5),
dpi = 100
))
print(base_plot)
夹层填充面积图---单色
import pandas as pd
import numpy as np
from plotnine import *
#from plotnine.data import *
import matplotlib.pyplot as plt
from datetime import datetime
#夹层填充面积图---单色
df=pd.read_csv('d:/python/out/LineD.csv')
df['date']=[datetime.strptime(d, '%Y/%m/%d').date() for d in df['date']]#df['date'].map(lambda x:datetime.datetime.strptime(x, '%Y/%m/%d').date())
df['ymin']=df[['AMZN','AAPL']].apply(lambda x: x.min(), axis=1)
df['ymax']=df[['AMZN','AAPL']].apply(lambda x: x.max(), axis=1)
melt_df=pd.melt(df[['date','AMZN','AAPL']],id_vars=["date"],var_name='variable',value_name='value')
base_plot4=(ggplot()+
geom_ribbon( aes(x ='date',ymin='ymin', ymax='ymax',group=1),df,alpha=0.5,fill="white",color="none")+
#geom_area(aes(fill=variable),alpha=0.5,position="identity")+
geom_line(aes(x ='date',y='value',color='variable',group='variable'),melt_df,size=0.75)+#color="black",
scale_x_date(date_labels = "%Y",date_breaks = "2 year")+
xlab("Year")+
ylab("Value")+
scale_colour_manual(name = "Variable",
labels = ("AMZN", "AAPL"),
values = ("#FF6B5E", "#00B2F6"))+
theme(
axis_title=element_text(size=10,face="plain",color="black"),
axis_text = element_text(size=10,face="plain",color="black"),
legend_background = element_blank(),
legend_position = (0.25,0.75),
aspect_ratio =0.85,
figure_size = (5, 5),
dpi = 100
))
print(base_plot4)
多数据系列图---面积图
import pandas as pd
import numpy as np
from plotnine import *
#from plotnine.data import *
import matplotlib.pyplot as plt
from datetime import datetime
df=pd.read_csv('d:/python/out/LineD.csv')
df['date']=[datetime.strptime(d, '%Y/%m/%d').date() for d in df['date']]#df['date'].map(lambda x:datetime.datetime.strptime(x, '%Y/%m/%d').date())
melt_df=pd.melt(df,id_vars=["date"],var_name='variable',value_name='value')
#-多数据系列图---面积图.
base_plot1=(ggplot(melt_df, aes(x ='date', y = 'value',group='variable') )+
geom_area(aes(fill='variable'),alpha=0.75,position="identity")+
geom_line(aes(color='variable'),size=0.75)+#color="black",
scale_x_date(date_labels = "%Y",date_breaks = "2 year")+
scale_fill_hue(s = 0.90, l = 0.65, h=0.0417,color_space='husl')+
xlab("Year")+
ylab("Value")+
theme( axis_title=element_text(size=10,face="plain",color="black"),
axis_text = element_text(size=10,face="plain",color="black"),
legend_position = (0.25,0.8),
legend_background = element_blank(),
aspect_ratio =0.85,
figure_size = (5, 5),
dpi = 100
))
print(base_plot1)
填充面积折线图---纯色填
import pandas as pd
import numpy as np
from plotnine import *
#from plotnine.data import *
import matplotlib.pyplot as plt
from datetime import datetime
#填充面积折线图. (a)纯色填
df=pd.read_csv('d:/python/out/AreaD.csv')
df['date']=[datetime.strptime(d, '%Y/%m/%d').date() for d in df['date']]#df['date'].map(lambda x:datetime.datetime.strptime(x, '%Y/%m/%d').date())
base_plot2=(ggplot(df, aes(x ='date', y = 'value',group=1) )+
geom_area(fill="#FF6B5E",alpha=0.75,color='none')+
geom_line(color="black",size=0.75)+
scale_x_date(date_labels = "%Y",date_breaks = "2 year")+
xlab("Year")+
ylab("Value")+
theme( axis_title=element_text(size=10,face="plain",color="black"),
axis_text = element_text(size=10,face="plain",color="black"),
#legend_background = element_blank(),
aspect_ratio =0.85,
figure_size = (5, 5),
dpi = 100)
)
print(base_plot2)
填充面积折线图---颜色映射填充
import pandas as pd
import numpy as np
from plotnine import *
#from plotnine.data import *
import matplotlib.pyplot as plt
from datetime import datetime
#填充面积折线图.(b)颜色映射填充.
#从scipy库中导入插值需要的方法 interpolate
from scipy import interpolate
import time
df=pd.read_csv('d:/python/out/AreaD.csv')
df['x']=[time.mktime(time.strptime(d, '%Y/%m/%d')) for d in df['date']]
f = interpolate.interp1d(df['x'], df['value'], kind='quadratic')
#插值方式:nearest:最邻近插值法;zero:阶梯插值;slinear、linear:线性插值;quadratic、cubic:2、3阶B样条曲线插值
x_new=np.linspace(np.min(df['x']),np.max(df['x']),600)
df_interpolate=pd.DataFrame(dict(x=x_new,value=f(x_new)))
df_interpolate['date']=[datetime.strptime(time.strftime('%Y-%m-%d', time.gmtime(d)), '%Y-%m-%d') for d in df_interpolate['x']]#df['date'].map(lambda x:datetime.datetime.strptime(x, '%Y/%m/%d').date())
base_plot3=(ggplot(df_interpolate, aes(x ='date', y = 'value',group=1) )+ #geom_area(fill="#FF6B5E",alpha=0.75)
geom_bar(aes(fill='value',colour='value'),stat = "identity",alpha=1,width =2)+
geom_line(color="black",size=0.5)+
scale_color_cmap(name ='Reds')+
# scale_color_gradientn(colours=brewer.pal(9,'Reds'),name = "Value")+
scale_x_date(date_labels = "%Y",date_breaks = "2 year")+
xlab("Year")+
ylab("Value")+
guides(fill=False)+
theme(
axis_title=element_text(size=10,face="plain",color="black"),
axis_text = element_text(size=10,face="plain",color="black"),
legend_background = element_blank(),
legend_position = (0.25,0.65),
aspect_ratio =0.85,
figure_size = (5, 5),
dpi = 100
))
print(base_plot3)
使用matplotlib包绘制多数据系列折线图和面积图
matplotlib包的plt.plot()函数和plt.fill_between()函数可以绘制多数据系列折线图和面积图
多数据系列图---折线图
import seaborn as sns
import pandas as pd
import matplotlib.pyplot as plt
from datetime import datetime
df=pd.read_csv('d:/python/out/LineD.csv',index_col =0)
df.index=[datetime.strptime(d, '%Y/%m/%d').date() for d in df.index]
#多数据系列图---折线图
fig =plt.figure(figsize=(5,4), dpi=100)
plt.plot(df.index, df.AMZN, color='#F94306', label='AMZN')
plt.plot(df.index, df.AAPL, color='#06BCF9', label='AAPL')
plt.xlabel("Year")
plt.ylabel("Value")
plt.legend(loc='upper left',edgecolor='none',facecolor='none')
plt.show()
多数据系列图---面积图
import seaborn as sns
import pandas as pd
import matplotlib.pyplot as plt
from datetime import datetime
df=pd.read_csv('d:/python/out/LineD.csv',index_col =0)
df.index=[datetime.strptime(d, '%Y/%m/%d').date() for d in df.index]
#多数据系列图.(b)面积图.
columns=df.columns
colors=["#F94306","#06BCF9"]
fig =plt.figure(figsize=(5,4), dpi=100)
plt.fill_between(df.index.values, y1=df.AMZN.values, y2=0, label=columns[1], alpha=0.75, facecolor=colors[0], linewidth=1,edgecolor ='k')
plt.fill_between(df.index.values, y1=df.AAPL.values, y2=0, label=columns[0], alpha=0.75, facecolor=colors[1], linewidth=1,edgecolor ='k')
plt.xlabel("Year")
plt.ylabel("Value")
plt.legend(loc='upper left',edgecolor='none',facecolor='none')
plt.show()
夹层填充面积图---单色
import seaborn as sns
import pandas as pd
import matplotlib.pyplot as plt
from datetime import datetime
#夹层填充面积图---单色
df=pd.read_csv('d:/python/out/LineD.csv')
df['date']=[datetime.strptime(d, '%Y/%m/%d').date() for d in df['date']]
df['ymin']=df[['AMZN','AAPL']].apply(lambda x: x.min(), axis=1)
df['ymax']=df[['AMZN','AAPL']].apply(lambda x: x.max(), axis=1)
fig =plt.figure(figsize=(5,4), dpi=100)
plt.fill_between(df.date.values, y1=df.ymax.values, y2=df.ymin.values, alpha=0.15, facecolor='black', linewidth=1,edgecolor ='k')
plt.plot(df.date, df.AMZN, color='#F94306', label='AMZN')
plt.plot(df.date, df.AAPL, color='#06BCF9', label='AAPL')
plt.xlabel("Year")
plt.ylabel("Value")
plt.legend(loc='upper left',edgecolor='none',facecolor='none')
plt.show()
