COCO数据集可视化
可视化内容包括
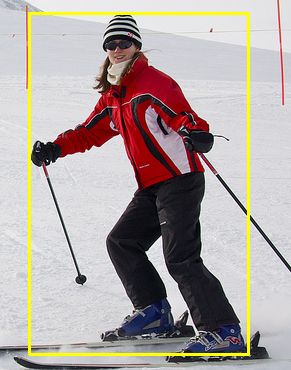
- 检测框
- 分割mask
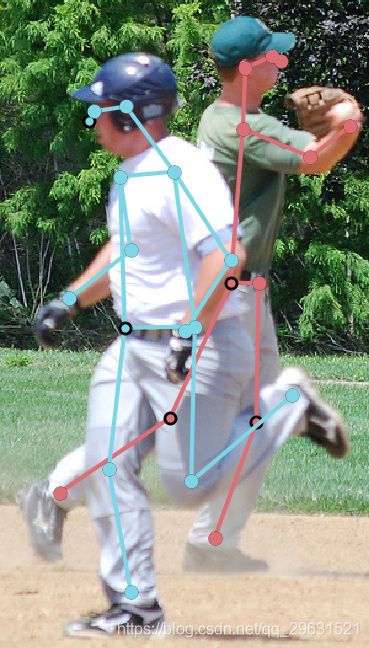
- 关节点
1.检测框的可视化
这里以人为例
1>可视化目标检测生成的检测框
import json
import os
import cv2

parent_path = '../datasets/coco/images/val2017'
json_file = 'coco_instances_val2017_results.json' # 目标检测生成的文件
with open(json_file) as annos:
    annotations = json.load(annos)

for i in range(len(annotations)):
    annotation = annotations[i]
    if annotation['category_id'] != 1: # 1表示人这一类
        continue
    image_id = annotation['image_id']
    bbox = annotation['bbox'] # (x1, y1, w, h)
    x, y, w, h = bbox
    image_path = os.path.join(parent_path, str(image_id).zfill(12) + '.jpg') # 记得加上.jpg
    image = cv2.imread(image_path)
    # 参数为(图像,左上角坐标,右下角坐标,边框线条颜色,线条宽度)
    # 注意这里坐标必须为整数,还有一点要注意的是opencv读出的图片通道为BGR,所以选择颜色的时候也要注意
    anno_image = cv2.rectangle(image, (int(x), int(y)), (int(x + w), int(y + h)), (0, 255, 255), 2)
    # 参数为(显示的图片名称,要显示的图片)  必须加上图片名称,不然会报错
    cv2.imshow('demo', anno_image)
    cv2.waitKey(5000)
import os
import cv2

from pycocotools.coco import COCO

json_file = r'F:/dataset/coco/2017/annotations/instances_val2017.json'
dataset_dir = r'F:/dataset/coco/2017/val2017/'
coco = COCO(json_file)
catIds = coco.getCatIds(catNms=['person']) # catIds=1 表示人这一类
imgIds = coco.getImgIds(catIds=catIds ) # 图片id,许多值
for i in range(len(imgIds)):
    img = coco.loadImgs(imgIds[i])[0]

    image = cv2.imread(dataset_dir + img['file_name'])
    annIds = coco.getAnnIds(imgIds=img['id'], catIds=catIds, iscrowd=None)
    annos = coco.loadAnns(annIds)

    bbox = annos[0]['bbox']
    x, y, w, h = bbox

    anno_image = cv2.rectangle(image, (int(x), int(y)), (int(x + w), int(y + h)), (0, 255, 255), 2)
    # 参数为(显示的图片名称,要显示的图片)  必须加上图片名称,不然会报错
    cv2.imshow('demo', anno_image)
    cv2.waitKey(5000)
2.分割mask的可视化
这里以人为例
1> 可视化数据集标注的mask
直接使用coco工具箱就可以了,需要先安装好cocoApi,安装方法
import os

from pycocotools.coco import COCO
from skimage import io
from matplotlib import pyplot as plt

json_file = '../datasets/coco/annotations/instances_val2017.json'
dataset_dir = '../datasets/coco/images/val2017/'
coco = COCO(json_file)
catIds = coco.getCatIds(catNms=['person']) # catIds=1 表示人这一类
imgIds = coco.getImgIds(catIds=catIds ) # 图片id,许多值
for i in range(len(imgIds)):
    img = coco.loadImgs(imgIds[i])[0]
    I = io.imread(dataset_dir + img['file_name'])
    plt.axis('off')
    plt.imshow(I) #绘制图像,显示交给plt.show()处理
    annIds = coco.getAnnIds(imgIds=img['id'], catIds=catIds, iscrowd=None)
    anns = coco.loadAnns(annIds)
    coco.showAnns(anns)
    plt.show() #显示图像

2. 可视化生成的mask
有时候生成的mask会使用RLE进行编码,这时需要加载文件,并且解码来可视化
import json
import os
import cv2
import numpy as np
from tqdm import tqdm
from pycocotools import mask as maskUtils

parent_path = 'datasets/coco/images/val2017'
json_file = 'inference/mask_rcnn_val2017_person_results.json'
with open(json_file) as anno_:
    annotations = json.load(anno_)

def apply_mask(image, segmentation):
    alpha = 0.5
    color = (0, 0.6, 0.6)
    threshold = 0.5
    mask = maskUtils.decode(segmentation) # 分割解码
    mask = np.where(mask >= threshold, 1, 0).astype(np.uint8)
    for c in range(3): # 3个通道
        # mask=1执行前一个,否则后一个
        image[:, :, c] = np.where(mask == 1,
                                  image[:, :, c] *
                                  (1 - alpha) + alpha * color[c] * 255,
                                  image[:, :, c])
    return image

results = []
for i in range(len(annotations)):
    annotation = annotations[i]
    image_id = annotation['image_id']
    # 包含size:图片高度宽度  counts:压缩后的mask  通过mask = maskUtils.decode(encoded_mask)解码,得到mask,需要导入from pycocotools import mask as maskUtils
    segmentation = annotation['segmentation']
    full_path = os.path.join(parent_path, str(image_id).zfill(12) + '.jpg')
    image = cv2.imread(full_path)
    mask_image = apply_mask(image, segmentation)
    cv2.imshow('demo', mask_image)
    cv2.waitKey(5000)
3. 可视化关节点
3.1 可视化数据集标注的关节点
import os
import cv2
import numpy as np
from pycocotools.coco import COCO
from pycocotools.cocoeval import COCOeval
from pycocotools import mask as maskUtils

from skimage import io
from matplotlib import pyplot as plt

dataset_dir = "../../dataset/coco/2017/"


coco = COCO(os.path.join(dataset_dir,'annotations','person_keypoints_val2017.json'))
catIds = coco.getCatIds(catNms=['person']) # catIds=1 表示人这一类
imgIds = 872
img = coco.loadImgs(imgIds)[0]
image_path = os.path.join(dataset_dir, 'images/val2017', str(imgIds).zfill(12) + '.jpg')
I = io.imread(image_path)
plt.axis('off')
plt.imshow(I) #绘制图像,显示交给plt.show()处理
bg = np.zeros((img['height'], img['width'], 3))
annIds = coco.getAnnIds(imgIds=img['id'], catIds=catIds, iscrowd=None)
anns = coco.loadAnns(annIds)
coco.showAnns(anns)
plt.show() #显示图像
3.2 可视化生成的关节点
import json
import os
import numpy as np
import cv2
import random
# 关节点连接性,COCO数据集关节点标注文件最后一行有提供
BODY_PARTS= [
    (16, 14),
    (14, 12),
    (17, 15),
    (15, 13),
    (12, 13),
    (6, 12),
    (7, 13),
    (6, 7),
    (6, 8),
    (7, 9),
    (8, 10),
    (9, 11),
    (2, 3),
    (1, 2),
    (1, 3),
    (2, 4),
    (3, 5),
    (4, 6),
    (5, 7)
]

parent_id = '/home/gaoyao/dataset/coco/2017/images/val2017'
imgid = 872
image_id = os.path.join(parent_id, str(imgid).zfill(12) + '.jpg')
anno_file = 'keypoints_val2017_results.json'
with open(anno_file) as annotations:
    annos = json.load(annotations)
colors = [(204, 204, 0),(51, 153, 51),(51,153,255)] # 标注关节点的颜色

def showAnns(img, keypoints, BODY_PARTS):
    img = img.copy()
    for i in range(len(keypoints)):
        kpt = np.array(keypoints[i]).reshape(-1, 3)

        for j in range(kpt.shape[0]):
            x = kpt[j][0]
            y = kpt[j][1]
            cv2.circle(img, (int(x), int(y)), 8, colors[i], -1) # 画点

        for part in BODY_PARTS:
            # 通过body_part_m来连线
            # 部位为part[0]的节点坐标,这里需要减去1.是因为得到的结果是以0开头的,而提供的是以1开头
            keypoint_1 = kpt[part[0] - 1]
            x_1 = int(keypoint_1[0]) # 单个部位坐标x
            y_1 = int(keypoint_1[1])
            keypoint_2 = kpt[part[1] - 1]
            x_2 = int(keypoint_2[0])
            y_2 = int(keypoint_2[1])
            if keypoint_1[2] > 0 and keypoint_2[2] > 0:
                # 画线  参数--# img:图像,起点坐标,终点坐标,颜色,线的宽度
                # opencv读取图片通道为BGR
                cv2.line(img, (x_1, y_1), (x_2, y_2), colors[i], 3)
    cv2.imshow('keypoints', img)
    cv2.waitKey(20000)

kpts = []
for i in range(len(annos)):
    #import pdb; pdb.set_trace()
    if imgid != annos[i]['image_id']:
        continue
    keypoints = annos[i]['keypoints']
    kpts.append(keypoints)
img = cv2.imread(image_id)
showAnns(img, kpts, BODY_PARTS)


