RegressionAnalysis回归分析代码分享
一元(多元)线性回归
%x = input('输入需要预测的一组数据:(如[0.10 0.11 0.12 ...)\n');
% 测试用例:
x1 = [0.1:0.01:0.18]';
%y = input('输入需要预测的一组数据:(如[0.10 0.11 0.12 ...)\n');
% 测试用例:
y = [42, 41.5, 45.0, 45.5, 45.0, 47.5, 49.0, 55.0, 50.0]';
plot(x1, y, '+') % 观察是否近似为线性模型
x = [ones(9, 1), x1];
[b, bint, r, rint, stats] = regress(y, x);
b %回归系数估计值
bint %回归系数置信区间
stats %检验回归系统的统计量:复判定系数等
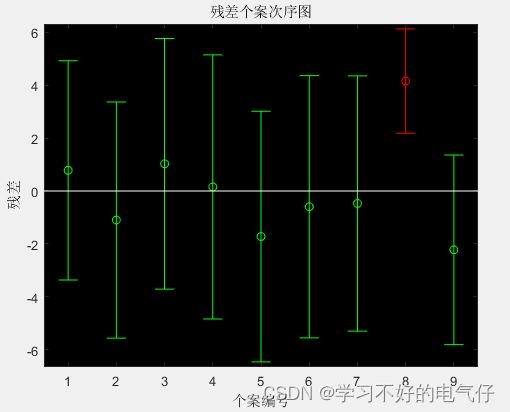
rcoplot(r, rint) %残差向量与残差置信区间
%--根据rcoplot的绘制结果,剔除异常点之后重新生成回归系统--%
多元二项式回归
% rstool(x, y, model, alpha)
% model有四种:线性,纯二次,交叉,完全二次
clc, clear
x1 = [120 140 190 130 155 175 125 145 180 150]';
x2 = [100 110 90 150 210 150 250 270 300 250]';
y = [102 100 120 77 46 93 26 69 65 85]';
x = [x1 x2];
rstool(x, y, 'purequadratic')
一元多项式回归模型
% 选取 y = a2*x^2 + a1*x + a0
clc, clear
x0 = 17: 2: 29;
y0 = [20.48, 25.13, 26.15, 30.0, 26.1, 20.3, 19.35];
[p, s] = polyfit(x0, y0, 2); % 2表示阶数
p % p返回a2,a1,a0三个参数
% 求polyfit所得的回归多项式在x0处的预测值Y
%及预测值的显著性为1-alpha的置信区间DELTA;
%alpha缺省时为0.05。它假设polyfit函数数据输入的误差是独立正态的,并且方差为常数
[y, delta] = polyconf(p, x0, s); % delta为置信区间半径
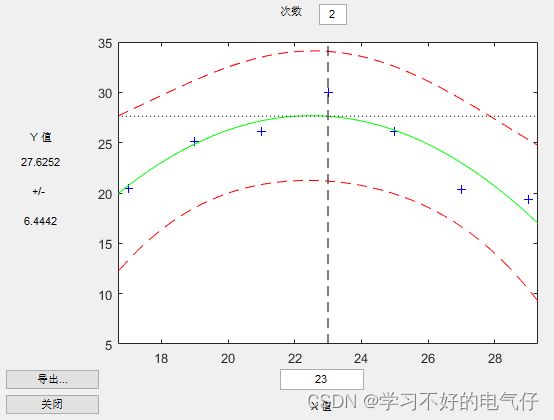
polytool(x0, y0, 2)
逐步回归模型
clc, clear
x0 = [1 8.55 470 300 10
2 3.79 285 80 10
3 4.82 470 300 120
4 0.02 470 300 120
5 2.75 470 80 10
6 14.39 100 190 10
7 2.54 100 80 65
8 4.35 470 190 65
9 13 100 300 54
10 8.5 100 300 120
11 0.05 100 80 120
12 11.32 285 300 10
13 3.13 285 190 120];
x = x0(:, 3:5);
y = x0(:, 2);
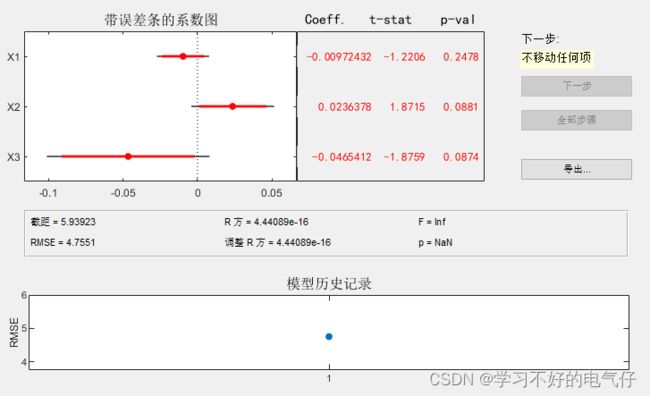
stepwise(x, y)
非线性回归
clc, clear
x0 = [1 8.55 470 300 10
2 3.79 285 80 10
3 4.82 470 300 120
4 0.02 470 300 120
5 2.75 470 80 10
6 14.39 100 190 10
7 2.54 100 80 65
8 4.35 470 190 65
9 13 100 300 54
10 8.5 100 300 120
11 0.05 100 80 120
12 11.32 285 300 10
13 3.13 285 190 120];
x = x0(:, 3:5);
y = x0(:, 2);
% 参数的初始预估值
beta = [0.1, 0.05, 0.02, 1, 2]';
[betahat, r, j] = nlinfit(x, y, @func, beta);
betaci = nlparci(betahat, r, 'jacobian', j);
% 回归系数以及置信区间
betaa = [betahat, betaci];
% y的预测值以及置信区间半径
[yhat, delta] = nlpredci(@func, x, betahat, r, 'jacobian', j);
% 绘制交互式画面
nlintool(x, y, 'func', beta)


