亚马逊图书销量前五十分析
背景
众所周知,亚马逊是全球最大的互联网书店。该数据集包含从2009年到2019年每年亚马逊上最畅销的前50的数据。包含550本书,使用Goodreads将数据分类为小说和非虚构类别。
导入相关包
import numpy as np
import pandas as pd
import matplotlib.pyplot as plt
import seaborn as sns

import plotly
import plotly.express as px
import plotly.graph_objs as go
import plotly.offline as py
from plotly.offline import iplot
from plotly.subplots import make_subplots
import plotly.figure_factory as ff
plt.rcParams['axes.unicode_minus']=False
plt.rcParams['font.sans-serif']=['SimHei']
文件导入及数据信息基本查看
df=pd.read_csv(r'E:\数据分析\数据分析案例\kaggle\bestsellers with categories.csv')
df.head()

df.info()
#数据类型无需更改
RangeIndex: 550 entries, 0 to 549
Data columns (total 7 columns):
Column Non-Null Count Dtype
0 Name 550 non-null object
1 Author 550 non-null object
2 User Rating 550 non-null float64
3 Reviews 550 non-null int64
4 Price 550 non-null int64
5 Year 550 non-null int64
6 Genre 550 non-null object
dtypes: float64(1), int64(3), object(3)
memory usage: 30.2+ KB
df.isnull().sum()
#数据无缺失
Name 0
Author 0
User Rating 0
Reviews 0
Price 0
Year 0
Genre 0
dtype: int64
df.nunique()
#可以看出有重复的作家,类型有两种
Name 351
Author 248
User Rating 14
Reviews 346
Price 40
Year 11
Genre 2
dtype: int64
df.duplicated().sum()
0
df.describe()

进行分析
df.sort_values('Reviews',ascending=False).head(10)
#存在同一本书在不同的年份均进入畅销书前50

df.drop_duplicates('Name').sort_values('Reviews',ascending=False).head(10)
#评论前10的非重复书籍信息

分析书籍类型
pie_1 = df.drop_duplicates('Name').sort_values('Reviews',ascending=False)['Genre'].head(10).value_counts()

plt.figure(figsize=(8,8))
plt.pie(pie_1,explode = [0,0.15],labels=['Fiction','Non Fiction'],autopct='%.1f%%',shadow=True,startangle=20)
plt.title('2009-2019年销量最好的前十名书籍的分类',fontdict={'size':14},y=0);

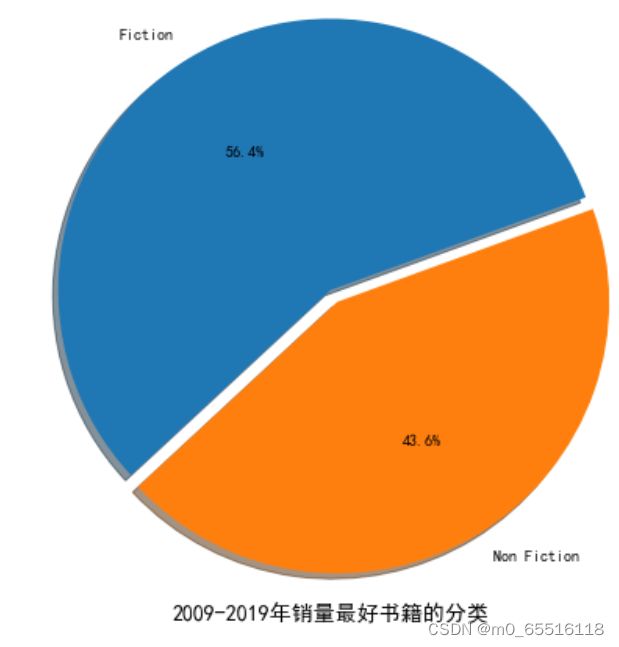
总体上小说与非虚构的比例
pie3=df['Genre'].value_counts()
plt.figure(figsize=(8,8))
plt.pie(pie3,explode = [0,0.05],labels=['Fiction','Non Fiction'],autopct="%.1f%%",shadow=True,startangle=20)
plt.title('2009-2019年销量最好书籍的分类',fontdict={'size':14},y=0);
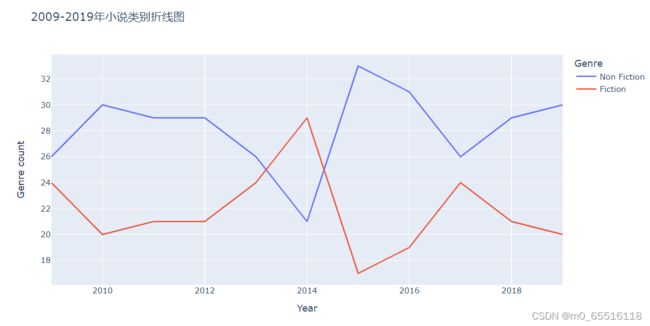
每年的图书种类
genre_by_year = df.groupby('Year')['Genre'].value_counts().reset_index(level=0).rename(columns={'Genre': 'Genre count'}, index={'index': 'Genre'})
fig = px.line(genre_by_year, x='Year', y='Genre count', color= genre_by_year.index, title='2009-2019年小说类别折线图')
fig.show()
#2009至2019年,总体上非虚构数量大于小说
作者分析
df['Author'].nunique()
#前25名作者
top_25_authors = df['Author'].value_counts()[:25]
top_25_authors
Jeff Kinney 12
Gary Chapman 11
Suzanne Collins 11
Rick Riordan 11
American Psychological Association 10
Dr. Seuss 9
Gallup 9
Rob Elliott 8
Dav Pilkey 7
Stephen R. Covey 7
Eric Carle 7
Bill O’Reilly 7
Stephenie Meyer 7
J.K. Rowling 6
Don Miguel Ruiz 6
Sarah Young 6
Stieg Larsson 6
E L James 6
Harper Lee 6
The College Board 6
R. J. Palacio 5
Roger Priddy 5
Giles Andreae 5
Dale Carnegie 5
John Grisham 5
Name: Author, dtype: int64
fig = px.bar(top_25_authors, x= top_25_authors.index, y=top_25_authors.values, title='前25名作者',labels={'y':'Number of Books', 'index':'Author'})
fig.update_layout(xaxis={'categoryorder':'total descending'})
fig.show()
#前25名作家均有不止一本书进入销量前50

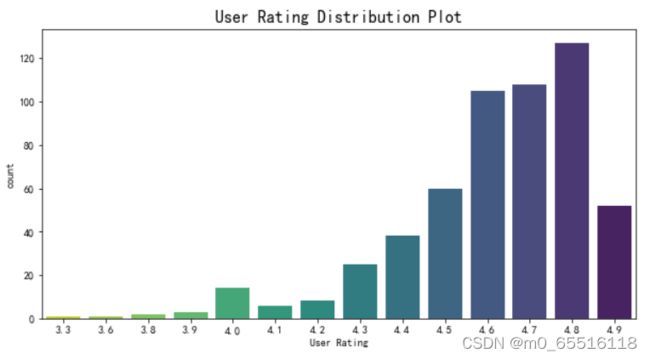
df['User Rating'].describe()
#平均分与中位数很近 接近正态分布
count 550.000000
mean 4.618364
std 0.226980
min 3.300000
25% 4.500000
50% 4.700000
75% 4.800000
max 4.900000
Name: User Rating, dtype: float64
plt.figure(figsize=(10,5))
sns.countplot(x=df['User Rating'],palette='viridis_r')
plt.title('User Rating Distribution Plot',fontsize=16)
plt.show()
价格
#每年的图书价格
fig = px.scatter(df, x='Year', y='Price', title='Price of the Books in Each Year', hover_data = df[['Name','Author']])
fig.show()

价格每年都在相同的范围内,有几个异常值。 基本位于0-30元之间
评价
fig = px.scatter(df, x='Year', y='Reviews', color='Genre',hover_data = df[['Name','Author']])
fig.show()
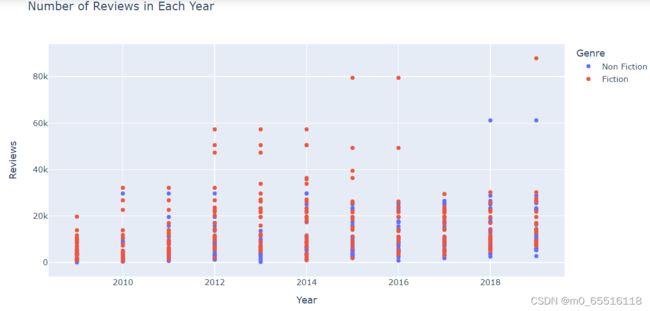
#结论 1.图书卖家在亚马逊卖书应着重选择小说类图书,且金额最好在30美元以内。 2.畅销作家的书比较容易成为高销量图书,可以重点关注这些作者的新书。 3.高销量的书大多数评分都在4.5以上,读者对图书的内容要求较高,因此在选品时应注意选择评分高的图书。