微信小程序+echart
微信小程序+echart
一、加载echart特定区域地图
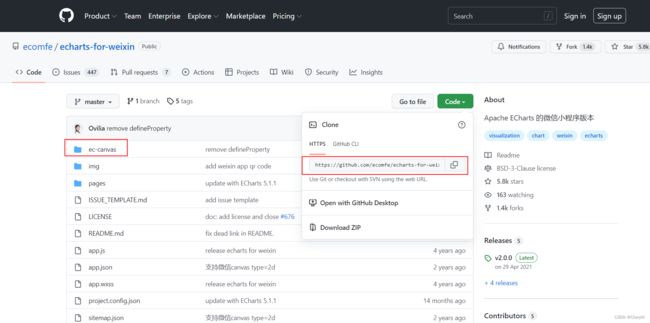
1、下载echarts小程序组件并放置到具体项目
组件下载地址

将代码拉取到本地,复制 ec-canvas 文件夹到小程序项目中(可在项目最外层创建component文件夹,后期如有其他组件引入,也可放入该文件夹下)
2、下载特定区域地图——JSON数据
地图数据下载地址

将山西省的JSON数据在浏览器中打开,CTRL+A,CTRL+C复制到js文件中,可在需要加载地图的页面文件夹下新建shanxi.js文件,使用module.exports = 页面上复制的内容将数据导出。
3、需求页面使用组件
修改需要使用地图页面的json文件,引入组件地址
{
	"usingComponents": {
    	"ec-canvas" : "../../component/ec-canvas/ec-canvas"
  	}
}
修改需要使用地图页面的js文件,将echarts组件及导出的JSON数据引入
import * as echarts from '../../component/ec-canvas/echarts';
import sxData from './shanxi';
4、在页面wxml文件添加canvas地图容器
<view class="map-content">
    <ec-canvas id="mychart-dom-map" canvas-id="mychart-map" ec="{{ ecMap }}" force-use-old-canvas="true"></ec-canvas>
</view>
样式根据需要自行调整
force-use-old-canvas="true"是为了解决echarts在滑动屏幕时不跟随scroll滑动
图表不跟随父元素及页面滑动
(1)增加force-use-old-canvas="true"属性
(2)看是否在 config里设置了config = {“disableScroll”:true},如果设置了需去掉
(3)看是否给外层标签定义了height:100%的属性或者overflow相关属性,如果设置了需去掉
(4)检查canvas的所有父级元素是否设置了height:100%,overflow相关属性(visible除外),以及position相关的属性(relative,static除外),如果设置了需去掉
5、定义初始化方法 initChart 并在data中声明参数 ecMap
var dataGeo = []; //散点图数据,可在请求接口成功后赋值
// 定义初始化方法 initChart
function initChart(canvas, width, height) {
	chart = echarts.init(canvas, null, {
	  width: width,
	  height: height
	});
	canvas.setChart(chart);
	echarts.registerMap('sx', sxData);
	var mapOption = {
		geo: {
			map: "sx",
			// roam: true, //拖拽及缩放
			zoom: 1.1,
			silent: true, //图形是否不响应和触发鼠标事件,默认为 false,即响应和触发鼠标事件
			top: 20,
			bottom: 20,
			scaleLimit: {
			  //滚轮缩放的极限控制
			  min: 0.5,
			  max: 20,
			},
			label: {
			  normal: {
				show: true,
				fontSize: "10",
				color: "rgba(0,0,0,0.7)",
			  },
			},
			itemStyle: {
			  normal: {
				areaColor:"#E6F3FF", // 地图填充颜色
				borderColor: "#1E9EFF", //边线颜色
			  },
			  emphasis: {
				areaColor: "#C9E2FC", //高亮状态(鼠标移入后)颜色
			  },
			},
		  },
		series: [{
			name: '项目散点图',
			type: 'scatter', //散点图
			coordinateSystem: 'geo',
			showAllSymbol: true,
			// 点颜色设置
			itemStyle: {
				color: '#FFC730'
			},
			symbolSize: 8,  // 散点的大小
			data: dataGeo, //一般为接口返回数据
		  }],
	};
	chart.setOption(mapOption);
	return chart;
  }
Page({
	data:{
		ecMap: {
			onInit: initChart
		}
	}
})
6、其他
(1)如需添加事件,如点击事件(可在initChart初始化时添加)
chart.on('click',function(params){
	console.log(params)
	// TODO 需要执行的方法
});
(2)地图容器内添加按钮,可在mapOption中新增graphic属性
graphic: [
	{
		type: 'group',
		right: 20,
		top: 5,
		children: [
			{
				type: 'rect', //矩形外框
				left: 'center',
				top: 'middle',
				shape: {
					width: 60,
					height: 30,
				},
				style: {
					fill: '#1E9EFF',
				}
			},
			{
				type: 'text', //框内文字
				z: 100,
				left: 'center',
				top: 'middle',
				style: {
					fill: '#fff',
					text: [
						'框内文字'
					],
					font: '10px Microsoft YaHei'
				}
			}
		],
	}
]
如需添加事件:
graphic[0]..onclick = ()=>{
	// TODO点击后需要执行的方法
}
(3)控制台报echarts颜色识别报错 非法颜色: none
旧版本 canvas 中会出现该报错
解决办法——在 echarts 的 ec-canvas 目录下找到 wx-canvas.js 文件,在该文件的 _initStyle 方法中加入如下代码:
var styles = ["fillStyle", "strokeStyle", "globalAlpha", "textAlign", "textBaseAlign", "shadow", "lineWidth", "lineCap", "lineJoin", "lineDash", "miterLimit", "fontSize",];
styles.forEach((style) => {
	Object.defineProperty(ctx, style, {
		set: (value) => {
			if ((style !== "fillStyle" && style !== "strokeStyle") ||(value !== "none" && value !== null)) {
				ctx["set" + style.charAt(0).toUpperCase() + style.slice(1)](value);
			}
		},
	});
});
二、加载echart柱状图折线图
引入及样式同上,不再赘述,不同之处仅在mapOption配置
1、柱状图
option = {
 	type: 'column',
    animation: true,
    height: 180, // 高度,单位为px
    dataZoom: [
      {   // 这个dataZoom组件,默认控制x轴,该参数用来控制图表滑动,数据展示较多时使用。
        type: 'inside', // 设置为inside则不显示滑块,表示内置
        start: 0,      // 左边在 0% 的位置。
        end: 40         // 右边在 40% 的位置。
      }
    ],
    legend: {
      data: ['图例1', '图例2'], // 对应图例即折线数
      textStyle: {
        // 图例文字样式
        fontSize: 10,
      },
      itemWidth: 15, // 每个图例宽度
    },
    xAxis: [{
      type: 'category',
      disableGrid: true,
      axisLabel: {
        formatter: function (value) {
          //x轴的文字改为竖版显示
          var str = value.split("");
          return str.join("\n");
        }
      },
      axisTick: {
        show: false, // 是否显示坐标轴刻度
      },
      data: ['小店区','迎泽区','杏花岭区','尖草坪区','万柏林区','晋源区','清徐县','阳曲县','娄烦县','古交市'], // x轴值
    }],
    yAxis:[ {
      type: 'value',
      interval: 20,  //y轴间隔
      min: 0,
      max: 100,
      name: '(个)', //y轴单位
    }],
    series: [{
      name: '图例1', //需要与图例中的data对应,否则不能正确显示
      type: 'bar',
      data: [23.2, 25.6, 76.7, 95.6, 62.2, 32.6, 20.0, 85, 45, 93], // 需要与x轴值数量一致
    },
    {
      name: '图例2',
      type: 'bar',
      data: [26.4, 28.7, 70.7, 75.6, 82.2, 48.7, 18.8, 95, 35, 63],
    }]
  }
2、折线图
option = {
    type: 'column',
    animation: true,
    height: 180, // 高度,单位为px
    extra: {
      column: {
        width: 20, // 柱状图每项的图形宽度,单位为px
      },
    },
    dataZoom: [
      {   // 这个dataZoom组件,默认控制x轴,用于数据过多时滑动展示
        type: 'inside',
        start: 0,      // 左边在 0% 的位置。
        end: 50         // 右边在 50% 的位置。
      }
    ],
    legend: {
      data: ['图例1', '图例2'],
      textStyle: {
        // 图例文字样式
        fontSize: 10,
      },
      itemWidth: 35,
    },
    xAxis: [{
      type: 'category',
      disableGrid: true,
      axisLabel: {
        interval: 0,
        formatter: function (value) {
        // 月前添加换行,使月份竖排展示
          return value.split("月").join("\n月");
        }
      },
      axisTick: {
        show: false, // 是否显示坐标轴刻度
      },
      data: [
        '1月',
        '2月',
        '3月',
        '4月',
        '5月',
        '6月',
        '7月',
        '8月',
        '9月',
        '10月',
        '11月',
        '12月',
      ],
    }],
    yAxis:[ {
      type: 'value',
      interval: 200,
      min: 0,
      max: 999,
      name: '(个)',
    }],
    series: [{
      name: '图例1',
      type: 'line',
      symbol: 'circle', //不设置折线拐点为空心点,设置后为实心点
      data: [
        120, 132, 101, 134, 90, 230, 210, 85, 45, 93, 800, 680
      ],
    },
    {
      name: '图例2',
      type: 'line',
      symbol: 'circle',
      data: [
        680, 120, 132, 550, 134, 430, 230, 820, 85, 450, 930, 800
      ],
    }]
  }
改变折线点和折线的颜色
series: [
	{
		name: "温度",//鼠标放在折线点上显示的名称
		type: "line",//折线图
		symbol: 'circle',//折线点设置为实心点
		symbolSize: 4,   //折线点的大小
		itemStyle: {
			normal: {
				color: "#386db3",//折线点的颜色
				lineStyle: {
					color: "#386db3"//折线的颜色
				}
			}
		},
]
3、显示不全问题
(1)坐标轴数据超出显示范围(数值超过999的时候会显示不全)
添加grid配置:
grid:{
	left:'18',
	containLabel:true,
}
官方文档
(2)坐标轴刻度标签显示不全,比如1-12月只隔一个月才显示月份刻度
添加axisLabel配置:
axisLabel: {
	interval: 0,
}
官方文档
三、微信小程序跳转页面问题
1、跳转至tabBar(菜单页)页面,并关闭其他所有非 tabBar页面
wx.switchTab({
	url: '路径' // 同app.json中配置的tabBar路径
})
2、跳转至其他页面(非tabBar页面),该方法会关闭当前页面,左上角不会有返回按钮。
wx.redirectTo({
	url: '../'      //url默认为本页面
})
3、此方法不会关闭当前页面,且页面最多层叠10层(非tabBar页面)
wx.navigateTo({
	url: '路径'
})
注: switchTab 只能跳转到带有 tabBar 的页面,不能跳转到不带 tabBar的页面,跳转不带 tabBar的页面用 redirectTo 或者 navigateTo。
四、实现小程序image图片根据宽度自适应
在对应wxss设置image宽度,如width:50%
<image src="图片地址" mode="widthFix" show-menu-by-longpress>
show-menu-by-longpress可实现长按保存并分享,存在版本兼容的问题
在JS文件中添加如下代码,可查看是否支持使用该属性,该属性要求小程序的最低基础库版本号是2.7.0
wx.canIUse('image.show-menu-by-longpress')
五、小程序中的事件
使用bind在WXML组件中绑定事件,使用data-*绑定事件参数:
<button id="btn" data-dj="WeChat" bindtap="test"> Click</button>
.js文件中添加事件方法
Page({
  test: function(e) {
    console.log(e)
  }
})
id为btn的按钮被点击后,事件处理函数test会被执行,点击按钮时将会传入event