Django框架项目案例---linux服务器信息查看应用(sysinfo)
1 sysinfo功能介绍
sysinfo是一个基于python Django( 一种Python Web 框架)框架和psutil开发的一个中文版linux服务器信息查看应用,其中,psutil (python system and process utilities) 是一个跨平台的第三方库,能够轻松实现获取系统运行的进程和系统利用率(包扩CPU、内存、磁盘、网络等)信息。它主要用于系统监控、分析、限制系统资源和进程的管理。将Django框架和psutil结合,通过web界面查看系统,CPU,内存,硬盘,进程,网络等信息。
2 创建项目
2.1 创建jdango项目
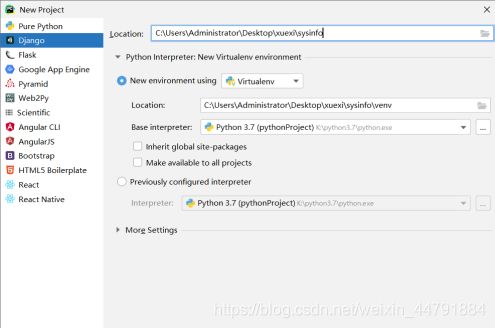
方法1:设置存储路径,环境设置为虚拟环境。在虚拟环境里面只需要安装Django相关包即可。
方法2:cd进入您要存储代码的目录,然后运行以下命令
django-admin startproject sysinfo
初始项目包含以下内容:

初始项目内容介绍:
manage.py:一个命令行实用程序,可让您以各种方式与此 Django 项目进行交互
init.py: 一个空文件,告诉 Python 这个目录应该被认为是一个 Python 包。
settings.py:此 Django 项目的设置/配置。
urls.py:这个 Django 项目的 URL 声明。
asgi.py:兼容 ASGI 的 Web 服务器的入口点,可为您的项目提供服务。
wsgi.py:WSGI 兼容的 Web 服务器的入口点,用于为您的项目提供服务。
2.2创建子应用host
python manage.py startapp host #创建子应用的命令

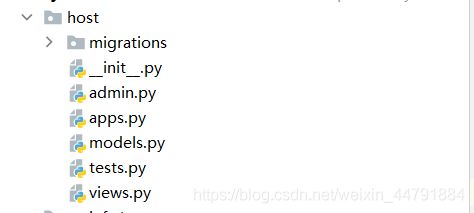
admin.py文件跟网站的后台管理站点配置相关。
apps.py文件用于配置当前子应用的相关信息。
migrations目录用于存放数据库迁移历史文件。
models.py文件用户保存数据库模型类。
tests.py文件用于开发测试用例,编写单元测试。
views.py文件用于编写Web应用视图。
2.3汉化,设置时区,注册子应用
settings.py是一个普通的 Python 模块,具有代表 Django 设置的模块级变量。
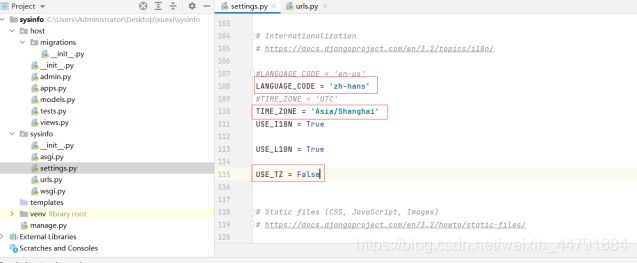

注意点:创建出来的子应用目录文件虽然被放到了工程项目目录中,但是django工程并不能立即直接使用该子应用,需要注册安装后才能使用。
2.4生成迁移文件并设置管理员用户
python manage.py makemigrations   ##生成迁移脚本
python manage.py migrate # 将迁移脚本的内容写入数据库并创建数据库表
python manage.py createsuperuser # 创建后台登录的管理员用户
2.5 测试是否成功
运行jdango项目

注意点:如果要更改服务器的端口,请将其作为命令行参数传递。
此时可以访问,如下所示。

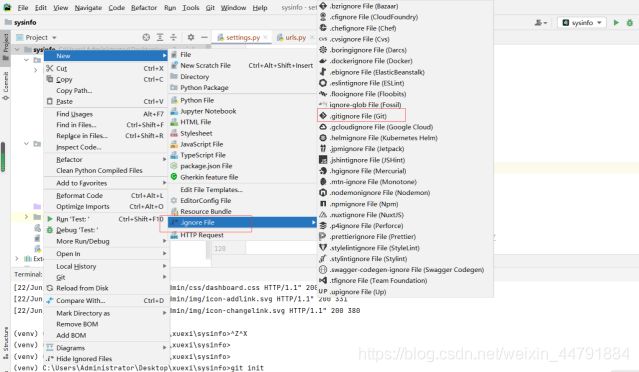
2.6git管理
3.创建README.md
(venv)C:\Users\Administrator\Desktop\xuexi\sysinfo>git init  #初始化仓库
(venv)C:\Users\Administrator\Desktop\xuexi\sysinfo>git add *   #将文件添加到暂存区
(venv)C:\Users\Administrator\Desktop\xuexi\sysinfo>git commit -m "add requirements.txt and README.md" #提交到本地仓库
(venv)C:\Users\Administrator\Desktop\xuexi\sysinfo>git log
3 搭建初始框架
3.1主路由配置
将根 URLconf 指向host.urls模块。
#sysinfo/urls.py  ##主urls
from django.contrib import admin
from django.urls import path, include

urlpatterns = [
    path('admin/', admin.site.urls),
    path('', include('host.urls')), ##子路由有很多项,可以先将主路由指向子路由。
]
注意:要从 URL 捕获值,请使用尖括号。
捕获的值可以选择包含转换器类型。例如,用于 int:name捕获整数参数。如果不包括转换器/,则匹配任何字符串,不包括字符。
不需要添加前导斜杠,因为每个 URL 都有。
3.2 子路由配置
一般每个小app的路由会写在app目录中的,所以需要自己创建一个usrl.py的文件来写app的路由,然后在项目的urls.py中只指向它。
功能:访问某路径时,执行哪一个视图函数
## host/urls.py  app对应的urls,为了关联视图函数
from django.contrib import admin
from django.urls import path, include
from .views import *
urlpatterns = [
    path('', index, name='index'),
    path('user/', user, name='user'),#访问前面的路径,会执行后面的视图函数
    path('cpu/', cpu, name='cpu'),
    path('memory/', memory, name='memory'),
    path('disk/', disk, name='disk'),
    path('network/', network, name='network'),
    path('process/', process, name='process'),
]
一旦其中一个 URL 模式匹配,Django 就会导入并调用给定的视图函数。
3.3视图函数配置
功能:逻辑处理执行哪一个前端模板
#host/views.py  视图函数
from django.shortcuts  import render
# Create your views here.
def index(request):
    pass
    return  render(request, 'host/index.html', locals())
def user(request):
    pass
    return  render(request, 'host/user.html', locals())
def cpu(request):
    pass
    return  render(request, 'host/cpu.html', locals())
def memory(request):
    pass
    return  render(request, 'host/memory.html', locals())
def disk(request):
    pass
    return  render(request, 'host/disk.html', locals())
def network(request):
    pass
    return  render(request, 'host/network.html', locals())
def process(request):
    pass
    return  render(request, 'host/process.html', locals())
注意:视图可以从数据库中读取记录,也可以不读取。它可以使用模板系统,例如 Django 或第三方 Python 模板系统,也可以不使用。它可以生成 PDF 文件,输出 XML,即时创建 ZIP 文件,任何你想要的,使用任何你想要的 Python 库。
在本项目中是返回当地的模板。
3.4Html文件初始配置
3.5git管理

将本地仓库和远程仓库关联起来

上传

访问github,查看是否成功。

4 系统信息监控
4.1视图函数设置
#host/views.py   ##视图函数新增内容
from datetime import datetime
from django.shortcuts import render
import  psutil      ##导入psutil模块
import  os, platform  #导入os模块,platform模块,这些模块可以用来访问平台相关属性。
# Create your views here.
def index(request):
    """
    sys_name
    kernel_name
    kernel_no
    kernel_version
    sys_framework
    now_time
    boot_time
    up_time
    """
    try:
        info = os.uname()    ##linux系统是os.uname
    except Exception as e:
        info = platform.uname()   ##windows系统是platform.uname
    sys_name = info.node       ##主机名
    kernel_name = info.system  ##操作系统名称
    kernel_no = info.release
    kernel_version = info.version #内核版本
    sys_framework = info.machine
    boot_time = datetime.fromtimestamp(psutil.boot_time()) #开启时间
    now_time = datetime.now()    #现在时间
    up_time = now_time - boot_time   #运行时间
    return  render(request, 'host/index.html', locals())
4.2 setting设置
配置静态文件时,需要在setting.py里面加入如下几行代码。
##sysinfo/settings新增内容  声明使用的是static文件夹内容。
STATICFILES_DIRS = [
    BASE_DIR / "static",
]
STATIC_URL = '/static/'
4.3基模板配置
<!-- 基模板 -->
<!-- templates/host/base.html -->
<!DOCTYPE html>
<html {% block html_attribs %}{% endblock html_attribs %}>
<head>
    {% block head %}    <!-- 这里面可以自定义head 和title -->
        <meta http-equiv="Content-Type" content="text/html; charset=utf-8">
        <meta name="viewport" content="width=device-width, initial-scale=1">
        <title>{% block title %} {% endblock title %}</title>
        <link rel="stylesheet" type="text/css" href="/static/css/bootstrap.css">
        <link rel="stylesheet" type="text/css" href="/static/css/my-style.css">
        <script src="/static/js/jquery-3.1.1.min.js"></script>
    {% endblock head %}
</head>
<body>
<div class="sysinfo">
    <div class="navbar navbar-inverse" role="navigation">
        <div class="container">
            <div class="navbar-header">
                <a class="navbar-brand" href="/">Sys Info</a>
            </div>
            <div class="navbar-collapse collapse">
                <ul class="nav navbar-nav">
                    <li><a href="/">系统</a></li>  #web界面显示
                    <li><a href="/cpu/">CPU</a></li>
                    <li><a href="/memory/">内存</a></li>
                    <li><a href="/disk/">硬盘</a></li>
                    <li><a href="/network/">网络</a></li>
                    <li><a href="/process/">进程</a></li>
                    <li><a href="/user/">用户</a></li>
                </ul>
            </div>
        </div>
    </div>
    <div class="container">
        {% block content %}{% endblock %}
    </div>
</div>
</body>
</html>
4.4index.html模板配置
##templates/host/index.html
<!-- index.html -->
{% extends 'host/base.html' %}    ##导入基模版
{% block title %}Sys Info{% endblock %}
{% block content %}
    <div class="page-header">
        <h1>系统信息</h1>
    </div>
    <div>
        <table class="table table-bordered">
            <tr>
                <td>主机名</td>
                <td>{{ sys_name }}</td>
            </tr>
            <tr>
                <td>内核名称</td>
                <td>{{ kernel_name }}</td>
            </tr>
            <tr>
                <td>发行版本号</td>
                <td>{{ kernel_no }}</td>
            </tr>
            <tr>
                <td>内核版本</td>
                <td>{{ kernel_version }}</td>
            </tr>
            <tr>
                <td>系统架构</td>
                <td>{{ sys_framework }}</td>
            </tr>
            <tr>
                <td>现在时间</td>
                <td>{{ now_time }}</td>
            </tr>
            <tr>
                <td>开机时间</td>
                <td>{{ boot_time }}</td>
            </tr>
            <tr>
                <td>运行时间</td>
                <td>{{ up_time }}</td>
            </tr>
        </table>
    </div>
{% endblock %}
注意:我们可以将我们的模板直接放在 host/templates(而不是创建另一个host子目录)中,但这实际上是一个坏主意。Django 会选择它找到的第一个名称匹配的模板,如果你在不同的应用程序中有一个同名的模板,Django 将无法区分它们。我们需要能够将 Django 指向正确的位置,而确保这一点的最佳方法是对它们进行命名空间。也就是说,通过将这些模板放在另一个以应用程序本身命名的目录中。
##配置完成启动服务器
(venv) C:\Users\Administrator\Desktop\xuexi\sysinfo>python manage.py runserver
5登录用户信息监控
5.1视图函数配置
##host/views.py
def user(request):
    users = psutil.users()
    return  render(request, 'host/user.html', locals())
5.2自定义过滤器
#templatetags/timefilter.py
"""
自定义过滤器实现的方法:
https://docs.djangoproject.com/zh-hans/3.1/howto/custom-template-tags/
"""
from django import template
from datetime import  datetime
register = template.Library()

@register.filter(name='timefmt')   ##有两种实现方法,我使用的是装饰器的方法。
def timefmt(value):
    """将时间戳转换成datetime类型的时间"""
    return datetime.fromtimestamp(value)
5.3模板配置
{% extends 'host/base.html' %}    <!-- 继承基本模板 -->
{% load timefilter %}          <!--加载自定义过滤器 -->
{% block title %} 用户信息 {% endblock %}
{% block content %}
    <div class="page-header">
        <h1>登录用户</h1>
    </div>
    <div>
        <table class="table table-bordered">
            <tr>            <!-- tr行  , td 列 -->
                <td>用户名</td>
                <td>登录主机</td>
                <td>终端</td>
                <td>登录时间</td>
            </tr>

            {% for user in users %}    <!-- 循环用户并获取信息 -->
            <tr>
                <td>{{ user.name }}</td>
                <td>{{ user.terminal }}</td>
                <td>{{ user.host }}</td>
                <td>{{ user.started | timefmt }}</td>    <!--使用过滤器,可以是内置过滤器,也可以是自定义过滤器 -->
            </tr>
            {% endfor %}
        </table>
    </div>
{% endblock %}
6cpu信息展示
6.1视图函数配置
##host/views.py
def cpu(request):
    logical_core_num = psutil.cpu_count()  #
    physical_core_num = psutil.cpu_count(logical=False)
    try:
        load_avg = os.getloadavg()
    except Exception as e:
        load_avg = ['', '', '']
    cpu_time_percent = psutil.cpu_times_percent()
    else_percent = 0.0
    for i in range(5):
        else_percent += cpu_time_percent[i]
    try:
        cpu_freq = psutil.cpu_freq()
    except AttributeError:
        cpu_freq = None
    return  render(request, 'host/cpu.html', locals())
6.2自定义过滤器
##templatetags/timefilter.py
"""
自定义过滤器实现的方法:
https://docs.djangoproject.com/zh-hans/3.1/howto/custom-template-tags/
"""
from django import template
from datetime import  datetime
register = template.Library()

@register.filter(name='timefmt')
def timefmt(value):
    """将时间戳转换成datetime类型的时间"""
    return datetime.fromtimestamp(value)

@register.filter(name='cpu_val_fmt')    ##添加的自定义过滤器
def cpu_val_fmt(value):
    return  round(value/1000, 2)
6.3模板配置
{% extends 'host/base.html' %}
{% load timefilter %}
{% block title %} cpu信息 {% endblock %}
{% block content %}
    <div class="page-header">
        <a {% if not chart %}id="display"{% endif %} href="/cpu/">CPU 信息</a>
        <a {% if chart == 'line' %}id="display"{% endif %} href="/cpu/">CPU
            折线图</a>
        <a {% if chart == 'pie' %}id="display"{% endif %} href="/cpu/">CPU 饼图</a>
    </div>
    <div>
        <div id="cpu_info">
             <table class="table table-bordered">
            <tr>
                <td>物理 CPU 核心数</td>
                <td>{{ physical_core_num }}</td>
            </tr>
            <tr>
                <td>逻辑 CPU 核心数</td>
                <td>{{ logical_core_num }}</td>
            </tr>
            <tr>
                <td>最近 1 分钟平均负载</td>
                <td>{{ load_avg.0 }}</td>
            </tr>
            <tr>
                <td>最近 5 分钟平均负载</td>
                <td>{{ load_avg.1 }}</td>
            </tr>
            <tr>
                <td>最近 15 分钟平均负载</td>
                <td>{{ load_avg.2 }}</td>
            </tr>
            <tr>
                <td>用户</td>
                <td>{{ cpu_time_percent.user }} %</td>
            </tr>
            <tr>
                <td>系统</td>
                <td>{{ cpu_time_percent.system }} %</td>
            </tr>
            <tr>
                <td>空闲</td>
                <td>{{ cpu_time_percent.idle }} %</td>
            </tr>
            {% if cpu_time_percent.nice %}
                <tr>
                    <td>nice</td>
                    <td>{{ cpu_time_percent.nice }} %</td>
                </tr>
            {% endif %}
            {% if cpu_time_percent.iowait %}
                <tr>
                    <td>iowait</td>
                    <td>{{ cpu_time_percent.iowait }} %</td>
                </tr>
            {% endif %}
            {% if else_percent %}
                <tr>
                    <td>其他</td>
                    <td>{{ else_percent }} %</td>
                </tr>
            {% endif %}
            {% if cpu_freq %}
                <tr>
                    <td>正在运行频率</td>
                    <td>{{ cpu_freq.current | cpu_val_fmt }} GHz</td>
                </tr>
                <tr>
                    <td>最低运行频率</td>
                    <td>{{ cpu_freq.min | cpu_val_fmt }} GHz</td>
                </tr>
                <tr>
                    <td>最高运行频率</td>
                    <td>{{ cpu_freq.max | cpu_val_fmt }} GHz</td>
                </tr>
            {% endif %}
        </table>
        </div>

{% endblock %}
6.4CPU折线图和饼状图配置
6.4.1子路由配置
##host/urls
from django.contrib import adminhost/urls
from django.urls import path, include
from .views import *
urlpatterns = [
path('', index, name='index'),
path('user/', user, name='user'),
path('cpu/', cpu, name='cpu'),
path('cpu//' , cpu, name='cpu'), #指定名字
path('memory/', memory, name='memory'),
path('disk/', disk, name='disk'),
path('network/', network, name='network'),
path('process/', process, name='process'),
]
6.4.2视图函数配置
##host/views.py
 def cpu(request, chart=None):
    logical_core_num = psutil.cpu_count()  #
    physical_core_num = psutil.cpu_count(logical=False)
    try:
        load_avg = os.getloadavg()
    except Exception as e:
        load_avg = ['', '', '']
    cpu_time_percent = psutil.cpu_times_percent()
    else_percent = 0.0
    for i in range(3, 5):
        else_percent += cpu_time_percent[i]
    try:
        cpu_freq = psutil.cpu_freq()
    except AttributeError:
        cpu_freq = None
    if chart == 'line':
        return render(request, 'host/cpu-line.html', locals())
    elif chart == 'pie':
        return render(request, 'host/cpu-pie.html', locals())
    return render(request, 'host/cpu.html', locals())
6.4.3模型设置
##host/modules.py   ##此处的modules是为了之后的折线图做准备的
from django.db import models
# 定时任务定期扫描并存储。
class UserCpuPercent(models.Model):
    create_time = models.DateTimeField(auto_now_add=True, verbose_name="扫描时间")
    user_percent = models.FloatField(verbose_name="用户CPU占用百分比")

##配置了modules文件需要重新生成数据库迁移文件
(venv) C:\Users\Administrator\Desktop\xuexi\sysinfo>python manage.py makemigrations
(venv) C:\Users\Administrator\Desktop\xuexi\sysinfo>python manage.py migrate
6.4.4基模板设置
在之前基模板的基础上添加
##templates/base.html
    {% block head %}
        ............................
        <script src="https://lib.baomitu.com/echarts/5.0.2/echarts.min.js"></script>    #在原来的基础上添加,在此利用的是在线模板
        ............................
6.4.5模板配置
##templates/cpu.html
{% extends 'host/base.html' %}
{% load timefilter %}
{% block title %} cpu信息 {% endblock %}
{% block content %}
    <div>
        <div id="cpu_info">
             <table class="table table-bordered">
            <tr>
                <td>物理 CPU 核心数</td>
                <td>{{ physical_core_num }}</td>
            </tr>
            <tr>
                <td>逻辑 CPU 核心数</td>
                <td>{{ logical_core_num }}</td>
            </tr>
            <tr>
                <td>最近 1 分钟平均负载</td>
                <td>{{ load_avg.0 }}</td>
            </tr>
            <tr>
                <td>最近 5 分钟平均负载</td>
                <td>{{ load_avg.1 }}</td>
            </tr>
            <tr>
                <td>最近 15 分钟平均负载</td>
                <td>{{ load_avg.2 }}</td>
            </tr>
            <tr>
                <td>用户</td>
                <td>{{ cpu_time_percent.user }} %</td>
            </tr>
            <tr>
                <td>系统</td>
                <td>{{ cpu_time_percent.system }} %</td>
            </tr>
            <tr>
                <td>空闲</td>
                <td>{{ cpu_time_percent.idle }} %</td>
            </tr>
            {% if cpu_time_percent.nice %}
                <tr>
                    <td>nice</td>
                    <td>{{ cpu_time_percent.nice }} %</td>
                </tr>
            {% endif %}
            {% if cpu_time_percent.iowait %}
                <tr>
                    <td>iowait</td>
                    <td>{{ cpu_time_percent.iowait }} %</td>
                </tr>
            {% endif %}
            {% if else_percent %}
                <tr>
                    <td>其他</td>
                    <td>{{ else_percent }} %</td>
                </tr>
            {% endif %}
            {% if cpu_freq %}
                <tr>
                    <td>正在运行频率</td>
                    <td>{{ cpu_freq.current | cpu_val_fmt }} GHz</td>
                </tr>
                <tr>
                    <td>最低运行频率</td>
                    <td>{{ cpu_freq.min | cpu_val_fmt }} GHz</td>
                </tr>
                <tr>
                    <td>最高运行频率</td>
                    <td>{{ cpu_freq.max | cpu_val_fmt }} GHz</td>
                </tr>
            {% endif %}
        </table>
{% endblock %}
6.4.6编辑cpu-header.html
##templates/cpu-header.html
<div class="page-header">
    <a {% if not chart %}id="display"{% endif %} href="/cpu/">CPU 信息</a>
    <a {% if chart == 'line' %}id="display"{% endif %} href="/cpu/line/">CPU 折线图</a>
    <a {% if chart == 'pie' %}id="display"{% endif %} href="/cpu/pie/">CPU 饼图</a>
</div>
6.4.7编辑cpu-line.html
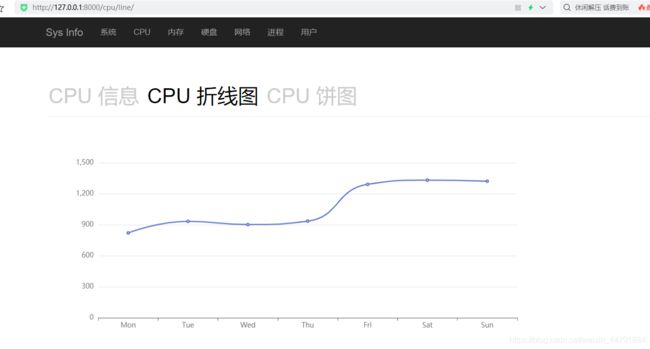
####templates/cpu-line.html   输入数据做一个测试
{% extends 'host/base.html' %}
{% load timefilter %}
{% block title %} cpu信息 {% endblock %}
{% block content %}
        {% include 'host/cpu-header.html' %}
    <div>
        <div id="main" style="width: 80%;height:400px;"></div>
    </div>
    <script type="text/javascript">
        // 基于准备好的dom,初始化echarts实例
        var myChart = echarts.init(document.getElementById('main'));

        option = {
            xAxis: {
                type: 'category',
                data: ['Mon', 'Tue', 'Wed', 'Thu', 'Fri', 'Sat', 'Sun']
            },
            yAxis: {
                type: 'value'
            },
            series: [{
                data: [820, 932, 901, 934, 1290, 1330, 1320],
                type: 'line',
                smooth: true
            }]
        };

        // 使用刚指定的配置项和数据显示图表。
        myChart.setOption(option);
    </script>
{% endblock %}
6.4.8 编辑cpu-pie.html
<!-- templates/cpu-pie.html -->
{% extends 'host/base.html' %}
{% load timefilter %}
{% block title %} cpu信息 {% endblock %}
{% block content %}
    {% include 'host/cpu-header.html' %}
    <div>
        <div id="main" style="width: 80%;height:400px;"></div>
    </div>
    <script type="text/javascript">
        // 基于准备好的dom,初始化echarts实例
        var myChart = echarts.init(document.getElementById('main'));

        option = {
            tooltip: {
                trigger: 'item'
            },
            legend: {
                top: '5%',
                left: 'center'
            },
            series: [
                {
                    name: 'CPU占用百分比分类',
                    type: 'pie',
                    radius: ['40%', '70%'],
                    avoidLabelOverlap: false,
                    itemStyle: {
                        borderRadius: 10,
                        borderColor: '#fff',
                        borderWidth: 2
                    },
                    label: {
                        show: false,
                        position: 'center'
                    },
                    emphasis: {
                        label: {
                            show: true,
                            fontSize: '40',
                            fontWeight: 'bold'
                        }
                    },
                    labelLine: {
                        show: false
                    },
                    data: [
                        {value: {{ cpu_time_percent.user }}, name: '用户'},
                        {value: {{ cpu_time_percent.system }}, name: '系统'},
                        {value: {{ cpu_time_percent.idle }}, name: '空闲'},

                    ]
                }
            ]
        };

        // 使用刚指定的配置项和数据显示图表。
        myChart.setOption(option);
    </script>
{% endblock %}
6.5git管理
7celery定时任务和异步任务
 Celery 是一个强大的分布式任务队列,它可以让任务的执行完全脱离主程序,甚至可以被分配到其他主机上运行。我们通常使用它来实现异步任务( async task )和定时任务( crontab )。 异步任务比如是发送邮件、或者文件上传, 图像处理等等一些比较耗时的操作 ,定时任务是需要在特定时间执行的任务,比如Redis中的数据每天凌晨两点保存至mysql数据库,实现Redis的持久化。
 Celery的架构由三部分组成,消息中间件(message broker),任务执行单元(celery worker)和任务执行结果存储(task result store)组成。
任务队列
任务队列是一种跨线程、跨机器工作的一种机制.
任务队列中包含称作任务的工作单元。有专门的工作进程持续不断的监视任务队列,并从中获得新的任务并处理.
任务模块
包含异步任务和定时任务。其中,异步任务通常在业务逻辑中被触发并发往任务队列,而定时任务由 Celery Beat 进程周期性地将任务发往任务队列。
消息中间件message broker
Broker ,即为任务调度队列,接收任务生产者发来的消息(即任务),将任务存入队列。 Celery 本身不提供队列服务,官方推荐使用 RabbitMQ 和 Redis 等。
任务执行单元 celery worker
Worker 是执行任务的处理单元,它实时监控消息队列,获取队列中调度的任务,并执行它。
任务结果存储task result store
Backend 用于存储任务的执行结果,以供查询。同消息中间件一样,存储也可使用 RabbitMQ, Redis 和 MongoDB 等。
7.1需要安装的软件包
7.2安装redis
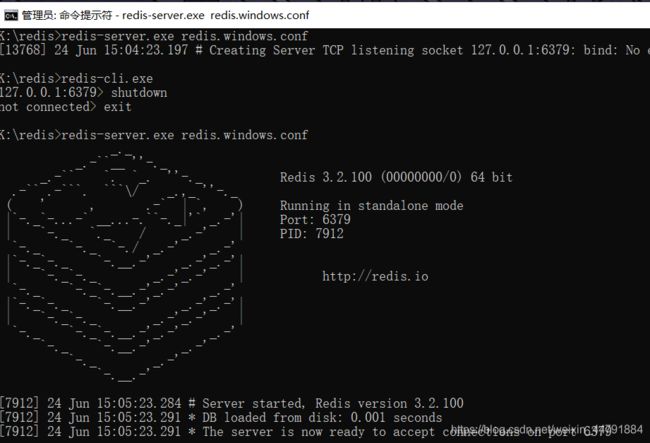
下载地址:https://github.com/MicrosoftArchive/redis/releases
7.3配置定时任务
(venv) C:\Users\Administrator\Desktop\xuexi\sysinfo>pip install celery
(venv) C:\Users\Administrator\Desktop\xuexi\sysinfo>pip install django-celery-beat

#sysinfo/celery.py   #celery.py相当于配置文档, 实例化celery,生成实例对象
from __future__ import absolute_import, unicode_literals
import os
from celery import Celery
# 设置django环境
os.environ.setdefault('DJANGO_SETTINGS_MODULE', 'sysinfo.settings')
app = Celery('sysinfo')
app.config_from_object('django.conf:settings', namespace='CELERY')
app.autodiscover_tasks()# 发现任务文件每个app下的task.py


#sysinfo/__init__.py
from __future__ import absolute_import, unicode_literals
from .celery import app as celery_app
__all__ = ['celery_app']     #将app展示出来,不然访问不到定时任务


#sysinfo/settings.py 文件内容,celery configure,必须安装redis。celery的配置默认都加CELERY_前缀)
CELERY_BROKER_URL = 'redis://127.0.0.1:6379/0' # Broker配置,broker是用来存放消息队列的,使用Redis作为消息中间件。最后一位‘0’, 是redis的槽位  0-15可用
CELERY_RESULT_BACKEND = 'redis://127.0.0.1:6379/1' # BACKEND配置,即配置结果存放地址。这里使用redis的槽位1
CELERY_RESULT_SERIALIZER = 'json' # 序列格式化
7.4 启动worker和编写定时任务
(venv) C:\Users\Administrator\Desktop\xuexi\sysinfo>pip install eventlet     #eventlet是具有WSGI支持的异步框架eventlet是python库函数,一个是处理和网络相关的,另一个可以通过协程实现并发可以实现'并发'(绿色线程)。
(venv) C:\Users\Administrator\Desktop\xuexi\sysinfo>pip install redis
(venv) C:\Users\Administrator\Desktop\xuexi\sysinfo>pip install django-celery-beat
(venv)C:\Users\Administrator\Desktop\xuexi\sysinfo>Celery -A sysinfo worker -l info -P eventlet    #安装包之后执行这条命令,连接数据库成功,worker启动成功。
注意:Celery 和Django 是互不相干的 如果只跑了Django项目,放在broker里面的任务并不会执行,两个都得开。
所以Celery要单独开启。
#host/tasks.py   #编辑定时任务
import psutil
from celery import shared_task
from host.models import UserCpuPercent
@shared_task()   ##装饰器共享任务
def scan_cpu_info():   #扫描cpu
    percent = UserCpuPercent( user_percent=psutil.cpu_times_percent().user)   ##获取用户占用cpu百分比
    percent.save()
7.5使用定时任务
(venv)  C:\Users\Administrator\Desktop\xuexi\sysinfo>pip install django-celery-beat

#sysinfo/settings.py 文件内容,注册app
INSTALLED_APPS = [
    'django.contrib.admin',
    'django.contrib.auth',
    'django.contrib.contenttypes',
    'django.contrib.sessions',
    'django.contrib.messages',
    'django.contrib.staticfiles',
    'django_celery_beat',
    'host',
]

数据库变更
(venv) C:\Users\Administrator\Desktop\xuexi\sysinfo>python manage.py makemigrations
(venv) C:\Users\Administrator\Desktop\xuexi\sysinfo>python manage.py migrate
7.6后端访问
7.7启动woker和beta
celery -A sysinfo beat -l info --scheduler django_celery_beat.schedulers:DatabaseScheduler  #启动beta 调度器使用数据库
Celery  -A sysinfo worker -l info -P eventlet#启动woker,之前启动过了就不需要了。
Celery  -A sysinfo worker-l info -P eventlet#这时多线程的方式,如果此时sql数据库仍然没有任何信息(实际操作),换成单线程。
Celery  -A sysinfo worker -l info --pool=solo   ##使用这条命令
celery -A sysinfo beat -l info --scheduler django_celery_beat.schedulers:DatabaseScheduler  #启动beta 调度器使用数据库
7.8git管理
8cpu折线图配置
8.1视图函数配置
#host/views.py
def cpu(request, chart=None):
    logical_core_num = psutil.cpu_count()  #
    physical_core_num = psutil.cpu_count(logical=False)
    try:
        load_avg = os.getloadavg()
    except Exception as e:
        load_avg = ['', '', '']
    cpu_time_percent = psutil.cpu_times_percent()
    else_percent = 0.0
    for i in range(3, 5):
        else_percent += cpu_time_percent[i]
    try:
        cpu_freq = psutil.cpu_freq()
    except AttributeError:
        cpu_freq = None
    if chart == 'line':
        datas = UserCpuPercent.objects.order_by('-id')[:30]   ##折线图显示最新30条记录
        return render(request, 'host/cpu-line.html', locals())
    elif chart == 'pie':
        return render(request, 'host/cpu-pie.html', locals())
    return render(request, 'host/cpu.html', locals())
8.2模板设置
<!-- templates/cpu-line.html -->
{% extends 'host/base.html' %}
{% load timefilter %}
{% block title %} cpu信息 {% endblock %}
{% block content %}
    {% include 'host/cpu-header.html' %}
    <div>
        <div id="main" style="width: 80%;height:400px;"></div>
    </div>
    <script type="text/javascript">
        // 基于准备好的dom,初始化echarts实例
        var myChart = echarts.init(document.getElementById('main'));
        {#首先,声明两个 javascript 的数组#}
        var series_data = [];
        var xAxis_data = [];
        {#使用循环,依次将数据库需要展示的数据添加到刚才声明的数组中#}
        {% for data in datas %}
            {#series_data.push({{ data.user_percent }})#}
            {#xAxis_data.push({{ data.create_time }})#}

            series_data.push({{ data.user_percent }})
            {#注意这里的双引号#}
            xAxis_data.push("{{ data.create_time}}")
        {% endfor %}
        option = {
            xAxis: {
                type: 'category',
                data: xAxis_data
            },
            yAxis: {
                type: 'value'
            },
            series: [{
                data: series_data,
                type: 'line',
                smooth: true
            }]
        };
        // 使用刚指定的配置项和数据显示图表。
        myChart.setOption(option);
    </script>
{% endblock %}


