目标检测--YOLO v1 论文阅读笔记(附代码)
文章目录
- 一、前言
-
- 1.0 灵感来源
- 1.1 创新点
- 1.2 存在的问题
- 二、网络主要结构
-
- 核心思想:
- 2.1 特征提取网络:
- 2.2 损失函数:
- 三、实验结果分析
- 四、代码解读
-
- 4.1 特征提取层:
- 4.2 定义检测头:
- 4.3 整体模型:
- 4.4 主函数:
- 4.5 train()函数:
- 4.6 训练集的数据处理函数:
-
- 4.6.1 input_process:
- 4.6.2 target_process:
- 4.7 Loss 函数
- 参考文献
算是写一个系列吧,目标检测的系列文章。
- Paper下载地址:You Only Look Once:Unified, Real-Time Object Detection
一、前言
Y O L O YOLO YOLO 算法运用分类的思想,进行对象的位置检测。
- 主要的特点是:
- (1)速度够快;
- (2)准确率也很高;
- (3)泛化能力强。
- F a s t e r R − C N N Faster R-CNN FasterR−CNN
- 首先通过 R P N RPN RPN 提取 r e g i o n p r o p o s a l region \ proposal region proposal,来判断是前景还是背景;
- 然后检测得到对象的坐标和类别 是双阶段的目标检测.。
- Y O L O YOLO YOLO 系列采用 E n d − t o − E n d End-to-End End−to−End 的方法直接预测目标对象的边界框和对象的类别。
- 以前目标检测的方法是通过窗口滑动确定目标的位置;
- YOLO则是直接将原始图片分割成互不重合的小方块,然后通过卷积得到特征图,再对特征图进行分类和回归,从而得到目标的位置。因此不会将背景块误检为目标。
- 与Faster R-CNN相比,YOLO v1的背景误检数量少了一半。
- 在应用于新领域或碰到意外的输入时不太可能出故障,所以泛化能力较强。
1.0 灵感来源
- Faster R-CNN中 的 RPN。
- YOLO v1可认为是one-scale RPN,因为yolo和RPN都one stage。区别就是二分类和多分类。
- 这里透露一下YOLO v3是 FPN 版本的 RPN。
1.1 创新点
(1)解决目标检测速度慢的问题。
(2)解决多目标检测。 → \rightarrow → NMS(非极大值移植)
(3)解决多类目标检测。 → \rightarrow → 带类别输出。
(4)解决小目标检测。 → \rightarrow → 输出大目标和小目标两类数据。
1.2 存在的问题
-
0)最主要的问题:精度低。
- 在 YOLO v2 中解决
-
1)对拥挤的物体检测不友好;
- 为什么?
1)7×7的 格子太稀疏了。
2)若是拥挤物体的核心都落在同一个 cell ,则无法处理。
- 为什么?
-
2)对小物体检测不友好;
- 为什么?
1)YOLO v1 只对, w , h w,h w,h进行了处理,比较简陋。
2)YOLO v1 直接回归坐标,不够精准。 - 解决方法:
采用 Anchor
- 为什么?
-
3)对 n e w w i d t h − h e i g h t r a t i o new \ width-height \ ratio new width−height ratio 物体不友好
- 什么叫做 n e w w i d t h − h e i g h t r a t i o new \ width-height \ ratio new width−height ratio 物体?
- 一个从未见过的,形变率较高的物体,一般的算法都解决不好。
- 什么叫做 n e w w i d t h − h e i g h t r a t i o new \ width-height \ ratio new width−height ratio 物体?
-
4)没有 B a t c h N o r m a l i z a t i o n Batch \ Normalization Batch Normalization
二、网络主要结构
核心思想:
- 对每张图像打栅格(cell): S × S [ 448 × 448 → 7 × 7 ] S × S [448 × 448 \rightarrow 7 × 7] S×S[448×448→7×7]
- 图像中,物体中心落在哪个格子,那个格子就负责预测那个物体。
- 物体中心与 Label 给定的物体中心回归计算 loss损失。
- 每个格子预测 B 个Bounding Box。同时,给出该预测框的 confidence。
- 预测单个不一定好,预测多个,选一个最好的。
也可以说 ,预测 B 个 Bounding Box 是 Anchor的雏形。 - confidence : P r ( o b j e c t ) ⋅ I o U p r e d t r u t h P_r(object) · IoU_{pred}^{truth} Pr(object)⋅IoUpredtruth。生成预测框的置信度。
- P r ( o b j e c t ) P_r(object) Pr(object) 预测框是否为目标,即为0 or 1。
- 输出 Tensor的维度是 S × S × ( 5 ∗ B + C ) S × S × (5 * B + C) S×S×(5∗B+C)。 在本文中是7 × 7 × (5 * 2 + 20)
- 为什么是 7 × 7?
因为 448 / 7 = 64
- 为什么是 7 × 7?
- 预测单个不一定好,预测多个,选一个最好的。
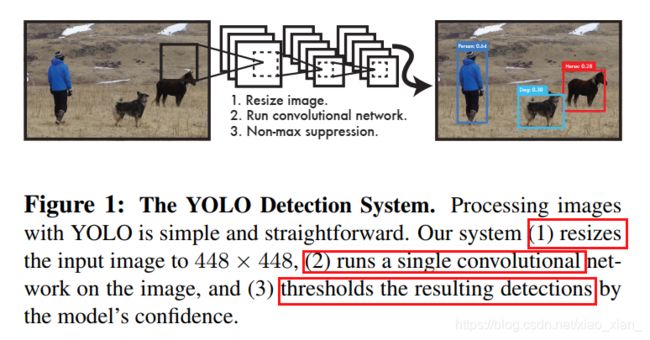
如下图所示,YOLO v1的网络结构共分为以下三个部分:
- (1)将图像 Resize 为 448 ∗ 448 {448 * 448} 448∗448大小
- (2)将图片送入到一个卷积网络(GoogleNet 作为backbone)
- (3)通过模型的置信度,并采用NMS(非极大值抑制)等策略,得到最后检测的目标。

2.1 特征提取网络:
-
用一串特定的数字,代表一个物体。
-
提取特征的逻辑是什么?
- 观察的逻辑,数据化
- 1)尺度不变性
- 2)光照不变性
- 3)旋转不变性
网络有24个卷积层,后面是2个全连接层,最后输出层用线性函数做激活函数,其它层激活函数都是Leaky ReLU。
我们 只使用11降维层,后面是33卷积层,

- 模型最后的输出是 7 × 7 × 30 7 × 7 × 30 7×7×30
- 7 × 7 7 × 7 7×7,代表的是图像分为了 7 × 7 = 49 个 块 7 × 7 =49个块 7×7=49个块
- 30 30 30,表示的是 2 × 5 + 20 2 × 5 + 20 2×5+20,
- 5表示的是(c,x,y,w,h);
- 2表示的大目标,和 小目标两类;
- 20表示的是具体的类别个数。【公式和图形表示,如下图所示】
2.2 损失函数:
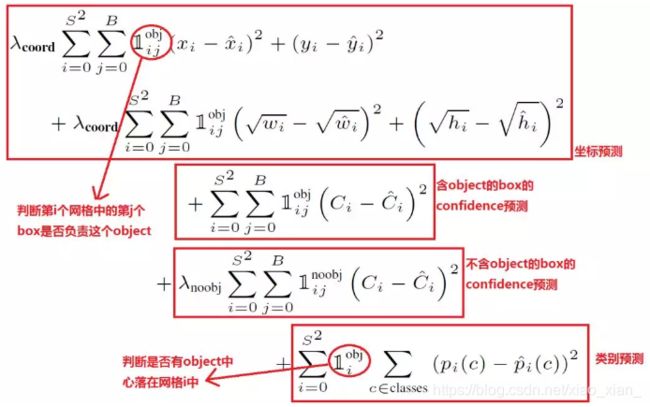
- S S S 为栅格的数量,在 Y O L O v 1 YOLO \ v1 YOLO v1中为 7 × 7 7 ×7 7×7。
- B B B 为每个栅格检测目标框的数量,在 Y O L O v 1 YOLO \ v1 YOLO v1中为 2 2 2。
- i ∈ [ 0 , S 2 − 1 ] i \in [0, S^2 -1] i∈[0,S2−1] 表示对每个栅格 ( c e l l ) (cell) (cell) 进行迭代。在 Y O L O v 1 YOLO \ v1 YOLO v1中为 0 ~ 48。
- j ∈ [ 0 , B − 1 ] j \in [0, B -1] j∈[0,B−1] 表示对每个预测框 ( b b o x ) (bbox) (bbox) 进行迭代。在 Y O L O v 1 YOLO \ v1 YOLO v1中为 0 ~ 2。
- 1 i j o b j \mathbb{1}_{ij}^{obj} 1ijobj & 1 i j n o o b j \mathbb{1}_{ij}^{noobj} 1ijnoobj
对于 1 i j o b j \mathbb{1}_{ij}^{obj} 1ijobj ,每个 cell 会预测 B 个bbox,但只有其中 IoU最大的预测框会标记为 1.
原则上, 1 i j o b j \mathbb{1}_{ij}^{obj} 1ijobj 与 1 i j n o o b j \mathbb{1}_{ij}^{noobj} 1ijnoobj互斥。
但,实际上,有可能两者都不属于。 - x , y , w , h x,y,w,h x,y,w,h:预测出的 bbox 的中心点坐标,bbox的长和宽。
- x ^ , y ^ , w ^ , h ^ \hat{x},\hat{y},\hat{w},\hat{h} x^,y^,w^,h^:已标注的 bbox的中心点坐标,bbox的长和宽。
- w , h \sqrt{w}, \sqrt{h} w,h 减少大物体边框的影响。也可以使用 log 函数。
- 为什么只对 w , h w,h w,h进行开方的操作?
因为:开方对大数比较敏感。
而,中心点是坐标(坐标跟着点走)影响不是很大。
所以不需要对 x , y x,y x,y 进行开方。
- 为什么只对 w , h w,h w,h进行开方的操作?
- λ c o o r d \lambda_{coord} λcoord:5。因为真实物体有点少,为了平衡第4行中“非物体” bbox过多的影响。
(2)第3行计算前景的confidence_loss。
(3)第4行计算背景的confidence_loss。
- C i ^ \hat{C_i} Ci^:预测与标注框的IoU (Confidence Score)
- C i C_i Ci: 网络生成的 Confidence Score。
- 注意:
C i ^ \hat{C_i} Ci^ 在第4行公式为 0 。
λ n o o b j = 0.5 \lambda_{noobj}=0.5 λnoobj=0.5,平衡过多的 “非物体” cell。 - 能不能去掉第4行公式?
- 不能,因为背景过于复杂,
- 为了使目标从背景中区分出来,那就只能从大量的学习非物体信息,从而提高泛化能力。
(4)第5行计算分类损失class_loss。
- 每个 cell 最终只预测 出一个物体边框。
- 由预测出的 B 个bbox 与 标注框计算 IoU 来决定。 选择 IoU 最高的标注框。
三、实验结果分析
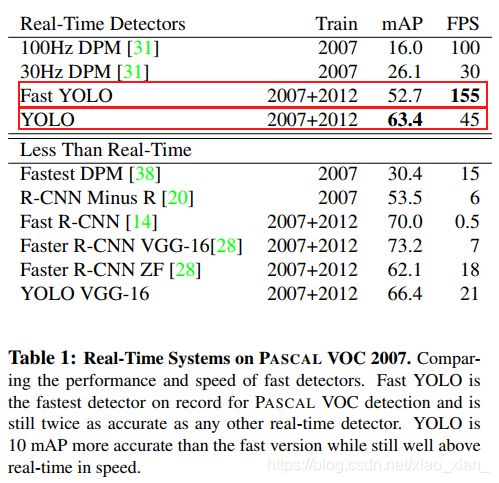
实时检测结果分析如下图所示:Fast YOLO 的速度是YOLO的两倍,但是YOLO的精度比Fast YOLO要高10个mAP。


四、代码解读
4.1 特征提取层:
class VGG(nn.Module):
    def __init__(self):
       super(VGG,self).__init__()
       # the vgg's layers
       #self.features = features
       cfg = [64,64,'M',128,128,'M',256,256,256,'M',512,512,512,'M',512,512,512,'M']
       layers= []
       batch_norm = False
       in_channels = 3
       for v in cfg:
           if v == 'M':
               layers += [nn.MaxPool2d(kernel_size=2,stride = 2)]
           else:
               conv2d = nn.Conv2d(in_channels,v,kernel_size=3,padding = 1)
               if batch_norm:
                   layers += [conv2d,nn.Batchnorm2d(v),nn.ReLU(inplace=True)]
               else:
                   layers += [conv2d,nn.ReLU(inplace=True)]
               in_channels = v
       # use the vgg layers to get the feature
       self.features = nn.Sequential(*layers)
       # 全局池化
       self.avgpool = nn.AdaptiveAvgPool2d((7,7))
       # 决策层:分类层
       self.classifier = nn.Sequential(
           nn.Linear(512*7*7,4096),
           nn.ReLU(True),
           nn.Dropout(),
           nn.Linear(4096,4096),
           nn.ReLU(True),
           nn.Dropout(),
           nn.Linear(4096,1000),
       )

       for m in self.modules():
           if isinstance(m,nn.Conv2d):   # 判断 m 是否为卷积层
               nn.init.kaiming_normal_(m.weight,mode='fan_out',nonlinearity='relu')
               if m.bias is not None:
                   nn.init.constant_(m.bias,0)
           elif isinstance(m,nn.BatchNorm2d):
               nn.init.constant_(m.weight,1)
               nn.init.constant_(m.bias,1)
           elif isinstance(m,nn.Linear):
               nn.init.normal_(m.weight,0,0.01)
               nn.init.constant_(m.bias,0)

    def forward(self,x):
         x = self.features(x)
         x_fea = x
         x = self.avgpool(x)
         x_avg = x
         x = x.view(x.size(0),-1)
         x = self.classifier(x)
         return x,x_fea,x_avg
    def extractor(self,x):
         x = self.features(x)
         return x
4.2 定义检测头:
self.detector = nn.Sequential(
          nn.Linear(512*7*7,4096),
          nn.ReLU(True),
          nn.Dropout(),
          nn.Linear(4096,1470),
       )
4.3 整体模型:
class YOLOV1(nn.Module):
    def __init__(self):
       super(YOLOV1,self).__init__()
       vgg = VGG()
       self.extractor = vgg.extractor
       self.avgpool = nn.AdaptiveAvgPool2d((7,7))
       # 决策层:检测层
       self.detector = nn.Sequential(
          nn.Linear(512*7*7,4096),
          nn.ReLU(True),
          nn.Dropout(),
          #nn.Linear(4096,1470),
          nn.Linear(4096,245),   # 和forward 中最后的输出 (7,7,5)相对应
          #nn.Linear(4096,5),
       )
       for m in self.modules():
           if isinstance(m,nn.Conv2d):
               nn.init.kaiming_normal_(m.weight,mode='fan_out',nonlinearity='relu')
               if m.bias is not None:
                   nn.init.constant_(m.bias,0)
           elif isinstance(m,nn.BatchNorm2d):
               nn.init.constant_(m.weight,1)
               nn.init.constant_(m.bias,1)
           elif isinstance(m,nn.Linear):
               nn.init.normal_(m.weight,0,0.01)
               nn.init.constant_(m.bias,0)
    def forward(self,x):
        x = self.extractor(x)
        #import pdb     # 终端调试代码用的包
        #pdb.set_trace()
        x = self.avgpool(x)
        x = x.view(x.size(0),-1)
        x = self.detector(x)
        b,_ = x.shape
        #x = x.view(b,7,7,30)
        x = x.view(b,7,7,5)

        #x = x.view(b,1,1,5)
        return x
4.4 主函数:
if __name__ == '__main__':
    vgg = VGG()
    x  = torch.randn(1,3,512,512)
    feature,x_fea,x_avg = vgg(x)
    print(feature.shape)
    print(x_fea.shape)
    print(x_avg.shape)

    yolov1 = YOLOV1()
    feature = yolov1(x)
    # feature_size b*7*7*30
    print(feature.shape)
4.5 train()函数:
def train():
    for epoch in range(epochs):
        ts = time.time()
        for iter, batch in enumerate(train_loader):
            optimizer.zero_grad()
            # 取图片
            inputs = input_process(batch)
            # 取标注
            labels = target_process(batch)

            # 获取得到输出
            outputs = yolov1_model(inputs)

            #loss = criterion(outputs, labels)
            loss,lm,glm,clm = lossfunc_details(outputs,labels)
            loss.backward()
            optimizer.step()
            #print(torch.cat([outputs.detach().view(1,5),labels.view(1,5)],0).view(2,5))
            if iter % 10 == 0:
            #    print(torch.cat([outputs.detach().view(1,5),labels.view(1,5)],0).view(2,5))
                print("epoch{}, iter{}, loss: {}, lr: {}".format(epoch, iter, /
                	   loss.data.item(),optimizer.state_dict()['param_groups'][0]['lr']))

        #print("Finish epoch {}, time elapsed {}".format(epoch, time.time() - ts))
        #print("*"*30)
        #val(epoch)
        scheduler.step()
4.6 训练集的数据处理函数:
4.6.1 input_process:
def input_process(batch):
    #import pdb
    #pdb.set_trace()
    batch_size=len(batch[0])
    input_batch= torch.zeros(batch_size,3,448,448)
    for i in range(batch_size):
        inputs_tmp = Variable(batch[0][i])
        inputs_tmp1=cv2.resize(inputs_tmp.permute([1,2,0]).numpy(),(448,448))
        inputs_tmp2=torch.tensor(inputs_tmp1).permute([2,0,1])
        input_batch[i:i+1,:,:,:]= torch.unsqueeze(inputs_tmp2,0)
    return input_batch
batch[0]为image,batch[1]为label,batch_size为1个batch的图片数量。
batch[0][i]为这个batch的第i张图片,inputs_tmp2为尺寸变成了3,448,448之后的图片,再经过unsqueeze操作拓展1维,size=[1,3,448,448],存储在input_batch中。
最后,返回的是size=[batch_size,3,448,448]的输入数据。
4.6.2 target_process:
def target_process(batch,grid_number=7):
    # batch[1]表示label
    # batch[0]表示image
    batch_size=len(batch[0])
    target_batch= torch.zeros(batch_size,grid_number,grid_number,30)
    #import pdb
    #pdb.set_trace()
    for i in range(batch_size):
        labels = batch[1]
        batch_labels = labels[i]
        #import pdb
        #pdb.set_trace()
        number_box = len(batch_labels['boxes'])
        for wi in range(grid_number):
            for hi in range(grid_number):
                # 遍历每个标注的框
                for bi in range(number_box):
                    bbox=batch_labels['boxes'][bi]
                    _,himg,wimg = batch[0][i].numpy().shape
                    bbox = bbox/ torch.tensor([wimg,himg,wimg,himg])
                    #import pdb
                    #pdb.set_trace()
                    center_x= (bbox[0]+bbox[2])*0.5
                    center_y= (bbox[1]+bbox[3])*0.5
                    #print("[%s,%s,%s],[%s,%s,%s]"%(wi/grid_number,center_x,(wi+1)/grid_number,hi/grid_number,center_y,(hi+1)/grid_number))
                    if center_x<=(wi+1)/grid_number and center_x>=wi/grid_number and center_y<=(hi+1)/grid_number and center_y>= hi/grid_number:
                        #pdb.set_trace()
                        cbbox =  torch.cat([torch.ones(1),bbox])
                        # 中心点落在grid内,
                        target_batch[i:i+1,wi:wi+1,hi:hi+1,:] = torch.unsqueeze(cbbox,0)
                    #else:
                        #cbbox =  torch.cat([torch.zeros(1),bbox])
                #import pdb
                #pdb.set_trace()
                #rint(target_batch[i:i+1,wi:wi+1,hi:hi+1,:])
                #target_batch[i:i+1,wi:wi+1,hi:hi+1,:] = torch.unsqueeze(cbbox,0)
    return target_batch
要从batch里面获得label,首先要想清楚label(就是bounding box)应该是什么size,输出的结果应该是 7 × 7 × 30 {7×7×30} 7×7×30 的,所以label的size应该是:[batch_size,7,7,30]。在这个程序里我们实现的是输出 7 × 7 × 5 {7×7×5} 7×7×5 。这个 5 {5} 5 就是x,y,w,h,所以label的size应该是:[batch_size,7,7,5]
batch_labels表示这个batch的第i个图片的label,number_box表示这个图有几个真值框。
接下来3重循环遍历每个grid的每个框,bbox表示正在遍历的这个框。
bbox = bbox/ torch.tensor([wimg,himg,wimg,himg])表示对x,y,w,h进行归一化。
接下来if语句得到confidence的真值,存储在target_batch中返回。
4.7 Loss 函数
def lossfunc_details(outputs,labels):
    # 判断维度
    assert ( outputs.shape == labels.shape),"outputs shape[%s] not equal labels shape[%s]"%(outputs.shape,labels.shape)

    b,w,h,c = outputs.shape
    loss = 0

    conf_loss_matrix = torch.zeros(b,w,h)
    geo_loss_matrix = torch.zeros(b,w,h)
    loss_matrix = torch.zeros(b,w,h)

    for bi in range(b):
        for wi in range(w):
            for hi in range(h):
                # detect_vector=[confidence,x,y,w,h]
                detect_vector = outputs[bi,wi,hi]
                gt_dv = labels[bi,wi,hi]
                conf_pred = detect_vector[0]
                conf_gt = gt_dv[0]
                x_pred = detect_vector[1]
                x_gt = gt_dv[1]
                y_pred = detect_vector[2]
                y_gt = gt_dv[2]
                w_pred = detect_vector[3]
                w_gt = gt_dv[3]
                h_pred = detect_vector[4]
                h_gt = gt_dv[4]
                loss_confidence = (conf_pred-conf_gt)**2
                #loss_geo = (x_pred-x_gt)**2 + (y_pred-y_gt)**2 + (w_pred**0.5-w_gt**0.5)**2 + (h_pred**0.5-h_gt**0.5)**2

                loss_geo = (x_pred-x_gt)**2 + (y_pred-y_gt)**2 + (w_pred-w_gt)**2 + (h_pred-h_gt)**2
                loss_geo = conf_gt*loss_geo
                loss_tmp = loss_confidence + 0.3*loss_geo
                #print("loss[%s,%s] = %s,%s"%(wi,hi,loss_confidence.item(),loss_geo.item()))
                loss += loss_tmp
                conf_loss_matrix[bi,wi,hi]=loss_confidence
                geo_loss_matrix[bi,wi,hi]=loss_geo
                loss_matrix[bi,wi,hi]=loss_tmp
    #打印出batch中每张片的位置loss,和置信度输出
    print(geo_loss_matrix)
    print(outputs[0,:,:,0]>0.5)
    return loss,loss_matrix,geo_loss_matrix,conf_loss_matrix
首先需要注意:label和output的size应该是:[batch_size,7,7,5]。
outputs[bi,wi,hi]就是一个5位向量: ( c p r e d , x p r e d , y p r e d , w p r e d , h p r e d ) {({c}^{pred}, {x}^{pred}, {y}^{pred}, {w}^{pred}, {h}^{pred} )} (cpred,xpred,ypred,wpred,hpred) 。
我们分别计算了loss_confidence和loss_geo,因为我们实现的这个模型只检测1个类,所以没有class_loss。
参考文献
你一定从未看过如此通俗易懂的YOLO系列(从V1到V5)模型解读!


