使用Echarts完成对中国地图的绘制
目录
- 前言
- 1.什么是Echarts插件
- 2.如何在vue中使用Echarts
- 3.中国地图的具体样式
- 4.如何使用Echarts来完成中国地图的绘制
- 5.总结
前言
- 我们在使用代码绘画地图的时候通常使用的是canvas,但是canvas是H5新增的东西,用起来不免有些麻烦,代码多,逻辑处理麻烦、本篇文章就利用echarts插件来完成中国地图的绘制
1.什么是Echarts插件
- 从官网的解释我们可以知道echarts是商业级数据图表,是一个纯JavaScript的图标库,兼容绝大部分的浏览器,底层依赖轻量级的canvas类库ZRender,提供直观,生动,可交互,可高度个性化定制的数据可视化图表。创新的拖拽重计算、数据视图、值域漫游等特性大大增强了用户体验,赋予了用户对数据进行挖掘、整合的能力。
简而言之,echarts就是一个帮助数据可视化的库。
2.如何在vue中使用Echarts
- 1.首先要安装Echarts插件 下载自己需要的版本即可
npm install [email protected] --save
注:不建议安装最新版本最新版本多少会有bug
- 2.在main.js中引入Echarts
import echarts from 'echarts'
// 挂载到vue原型中就可以全局使用
Vue.prototype.$echarts = echarts
- 3.在其他组件中使用
this.$echarts 即可使用
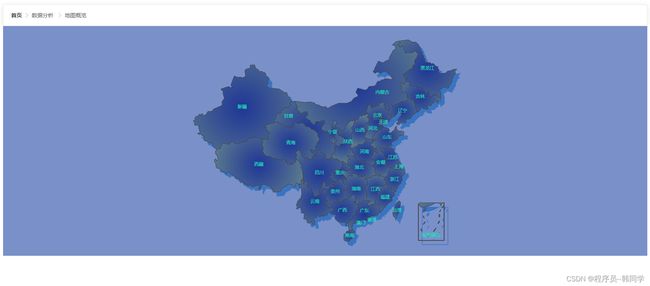
3.中国地图的具体样式
4.如何使用Echarts来完成中国地图的绘制
- 1.创建一个实例用来显式地图
- 2.引入中国地图资源包
中国地图的地址在 [email protected]@echarts\map\json 文件夹下
import geoJson from "echarts/map/json/china";
- 3.初始化echatrs实例,并挂载到dom容器中
let myChart = this.$echarts.init(document.getElementById("main"));
- 4.注册中国地图
this.$echarts.registerMap("china", geoJson);
- 5.配置中国地图所需的相关数据
let option = {
      // 背景色
      backgroundColor: "rgb(121,145,200)",
      // 配置项(组件)
      geo: {
        map: "china",
        // 地图的长宽比例
        aspectScale: 0.75,
        // 图层
        zoom: 1.1,
        // 样式
        itemStyle: {
          // 标准
          normal: {
            // 地图区域的颜色
            areaColor: {
              type: "radial",
              x: 0.5,
              y: 0.5,
              r: 0.8,
              // 颜色的步骤
              colorStops: [
                {
                  offset: 0,
                  color: "#09132c",
                },
                {
                  offset: 1,
                  color: "#274d68",
                },
              ],
              // 延长作用域
              globalCoord: true,
            },
            // 盒子的阴影
            shadowColor: "rgb(58,115,192)",
            // 偏移
            shadowOffsetX: 10,
            shadowOffsetY: 11,
          },
        },
        region: [
          {
            name: "南海诸岛",
            itemStyle: {
              opacity: 0,
            },
          },
        ],
      },
      series: [
        // 配置地图相关的数据参数
        {
          type: "map",
          label: {
            normal: {
              // 显示文字
              show: true,
              textStyle: {
                color: "#1DE9B6",
              },
            },
            emphasis: {
              textStyle: {
                color: "rgb(183,185,14)",
              },
            },
          },
          // 图层
          zoom: 1.1,
          map: "china",
          itemStyle: {
            normal: {
              // 背景色
              backgroundColor: "rgb(147,235,248)",
              // 边框
              borderWidth: 1,
              // 区域颜色
              areaColor: {
                type: "radial",
                x: 0.5,
                y: 0.5,
                // 文档
                r: 0.8,
                colorStops: [
                  { offset: 0, color: "rgb(34,54,150)" },
                  { offset: 1, color: "rgb(89,128,142)" },
                ],
                // 全局生效
                globalCoord: true,
              },
            },
            // 高亮效果
            emphasis: {
              areaColor: "rgb(46,229,206)",
              borderWidth: 0.1,
            },
          },
        },
      ],
    }
注意:注册的是中国地图,必须包括geo组件或者mep图标类型的时候才可以使用
- 6.将配置和数据添加到实例中
myChart.setOption(option);
- 7.做完以上这些就可以实现中国地图的绘制
5.总结
以上就是在vue中如何正确的使用echarts插件来完成中国地图的绘画和实现步骤。希望本篇文章能够帮助到你,不懂得可以评论区或者私信问我,我也会一 一解答。谢谢观看!
我的其他文章