Knowledge
1. 估计器:用于分类、聚类和回归分析
1.1 fit():训练算法,设置内部参数。该函数接收训练集及其类别两个参数。
1.2 predict():参数为测试集。预测测试集类别,并返回一个包含测试集各条数据类别的数组。
3. 转换器:用于数据预处理和数据转换
4. 流水线:组合数据挖掘流程,便于再次使用
Example
1. 数据集:http://archive.ics.uci.edu/ml/datasets/Ionosphere
下载ionosphere.data 和 ionosphere.names
2. 代码
2.1 引入包
import numpy
import numpy as np
import  csv
from sklearn.model_selection import train_test_split, ShuffleSplit
from sklearn.neighbors import KNeighborsClassifier
from sklearn.model_selection import cross_val_score
import matplotlib.pyplot as plt
2.2 一折验证
data_filename = os.path.join(os.getcwd(),"ionosphere.data")
x = numpy.zeros((351,34),dtype='float')
y = np.zeros((351,),dtype='bool')
with open(data_filename,'r') as input_file:
reader = csv.reader(input_file)
for i,row in enumerate(reader):
data = [float(datum) for datum in row[:-1]]
x[i] = data
y[i] = row[-1] == 'g'
x_train,x_test,y_train,y_test = train_test_split(x,y,random_state=14)
estimator = KNeighborsClassifier(n_neighbors=1)
estimator.fit(x_train,y_train)
y_predicted = estimator.predict(x_test)
accuracy = np.mean(y_test==y_predicted)*100
print("The accuracuy is {0:.1f}%".format(accuracy))
2.3 k折验证
data_filename = os.path.join(os.getcwd(),"ionosphere.data")
x = numpy.zeros((351,34),dtype='float')
y = np.zeros((351,),dtype='bool')
with open(data_filename,'r') as input_file:
reader = csv.reader(input_file)
for i,row in enumerate(reader):
data = [float(datum) for datum in row[:-1]]
x[i] = data
y[i] = row[-1] == 'g'
cv = ShuffleSplit(n_splits=10, test_size=0.3, random_state=0)
scores = cross_val_score(estimator,x,y,scoring='accuracy',cv=cv)
print(scores)
average_accuracy = np.mean(scores) *100
print("The accuracuy is {0:.1f}%".format(average_accuracy))
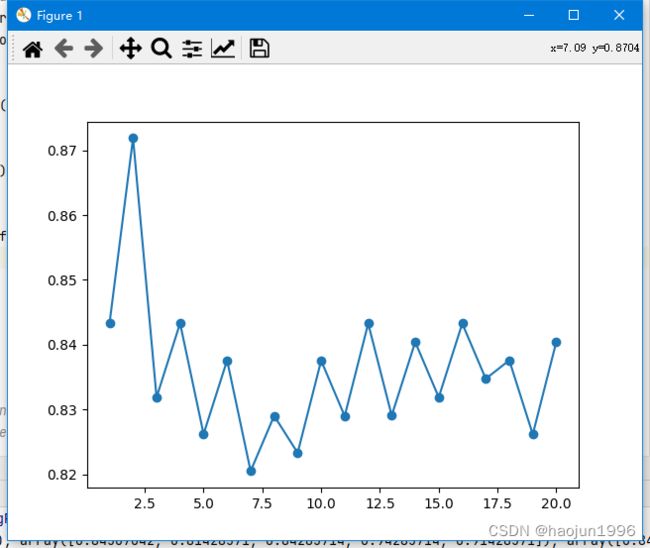
2.4 找到最优k并plot出来
data_filename = os.path.join(os.getcwd(),"ionosphere.data")
x = numpy.zeros((351,34),dtype='float')
y = np.zeros((351,),dtype='bool')
with open(data_filename,'r') as input_file:
reader = csv.reader(input_file)
for i,row in enumerate(reader):
data = [float(datum) for datum in row[:-1]]
x[i] = data
y[i] = row[-1] == 'g'
avg_scores = []
all_scores = []
parameter_values = list(range(1,21))
for n_neighbors in parameter_values:
estimator = KNeighborsClassifier(n_neighbors=n_neighbors)
scores = cross_val_score(estimator,x,y,scoring='accuracy')
avg_scores.append(np.mean(scores))
all_scores.append(scores)
print(all_scores)
plt.plot(parameter_values,avg_scores,'-o')
plt.show()
2.5 标准预处理
2.5.1 导入from sklearn.preprocessing import MinMaxScaler
2.5.2 对x进行预处理x_transformed = MinMaxScaler().fit_transform(x)
data_filename = os.path.join(os.getcwd(),"ionosphere.data")
x = numpy.zeros((351,34),dtype='float')
y = np.zeros((351,),dtype='bool')

with open(data_filename,'r') as input_file:
    reader = csv.reader(input_file)

    for i,row in enumerate(reader):
        data = [float(datum) for datum in row[:-1]]
        x[i] = data
        y[i] = row[-1] == 'g'

x_transformed = MinMaxScaler().fit_transform(x)
x_train,x_test,y_train,y_test = train_test_split(x_transformed,y,random_state=14)
estimator = KNeighborsClassifier(n_neighbors=2)
estimator.fit(x_train,y_train)
y_predicted = estimator.predict(x_test)
scores = cross_val_score(estimator,x,y,scoring='accuracy')
print("The accuracuy is {0:.1f}%".format(np.mean(scores)*100))
2.6 流水线
2.6.1 库:from sklearn.pipeline import Pipeline
scaling_pipeline = Pipeline([('scale',MinMaxScaler()),
                             ('predict',KNeighborsClassifier(n_neighbors=2))])
data_filename = os.path.join(os.getcwd(),"ionosphere.data")
x = numpy.zeros((351,34),dtype='float')
y = np.zeros((351,),dtype='bool')

with open(data_filename,'r') as input_file:
    reader = csv.reader(input_file)

    for i,row in enumerate(reader):
        data = [float(datum) for datum in row[:-1]]
        x[i] = data
        y[i] = row[-1] == 'g'

scaling_pipeline = Pipeline([('scale',MinMaxScaler()),
                             ('predict',KNeighborsClassifier(n_neighbors=2))])
scores = cross_val_score(scaling_pipeline,x,y,scoring='accuracy')

print("The accuracuy is {0:.1f}%".format(np.mean(scores)*100))
2.6.2 循环找最优k
data_filename = os.path.join(os.getcwd(),"ionosphere.data")
x = numpy.zeros((351,34),dtype='float')
y = np.zeros((351,),dtype='bool')
with open(data_filename,'r') as input_file:
reader = csv.reader(input_file)
for i,row in enumerate(reader):
data = [float(datum) for datum in row[:-1]]
x[i] = data
y[i] = row[-1] == 'g'
x_transformed = MinMaxScaler().fit_transform(x)
cv = ShuffleSplit(n_splits=10, test_size=0.3, random_state=0)
avg_scores = []
all_scores = []
parameter_values = list(range(1,21))
for n_neighbors in parameter_values:
estimator = KNeighborsClassifier(n_neighbors=n_neighbors)
scaling_pipeline = Pipeline([('scale', MinMaxScaler()),
('predict', KNeighborsClassifier(n_neighbors=n_neighbors))])
scores = cross_val_score(scaling_pipeline, x, y, scoring='accuracy')
avg_scores.append(np.mean(scores))
all_scores.append(scores)
plt.plot(parameter_values,avg_scores,'-o')
plt.show()