使用 ggplot2 画一个饼图【R语言】
前言
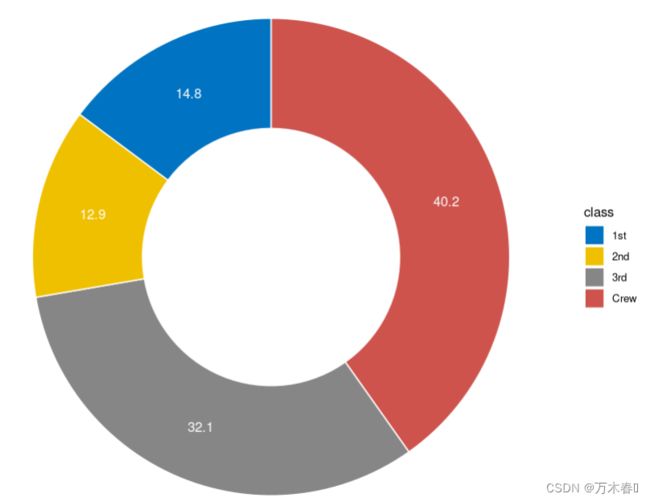
最近,可能会需要饼图,所以提前整理一下,用的时候直接翻出来,思路很简单,就是把柱状图换成极坐标的
需要什么
在R语言中,使用 ggplot2 做可视化,dplyr 做数据整理:
library("ggplot2")  # 数据可视化
library("dplyr")    # 数据处理
什么样的数据
刚开始数据是这个样子的:
count.data <- data.frame(
  class = c("1st", "2nd", "3rd", "Crew"),
  n = c(325, 285, 706, 885),
  prop = c(14.8, 12.9, 32.1, 40.2)
)

count.data
#   class   n prop
# 1   1st 325 14.8
# 2   2nd 285 12.9
# 3   3rd 706 32.1
# 4  Crew 885 40.2
我想要在图上标出比例的具体数值,放在图每块儿饼的中央,处理一下数据:
# Add label position
count.data <- count.data %>%
  arrange(desc(class)) %>% # 重排序
  mutate(lab.ypos = cumsum(prop) - 0.5*prop) #

count.data
##   class   n prop lab.ypos
## 1  Crew 885 40.2     20.1
## 2   3rd 706 32.1     56.3
## 3   2nd 285 12.9     78.8
## 4   1st 325 14.8     92.6
画图
一般饼图
- 主体部分使用:
geom_bar() + coord_polar()柱状图 + 坐标系转换 - 添加比例注释:
geom_text() - 修改颜色:
scale_color_manual() - 修改主题:
theme_void()
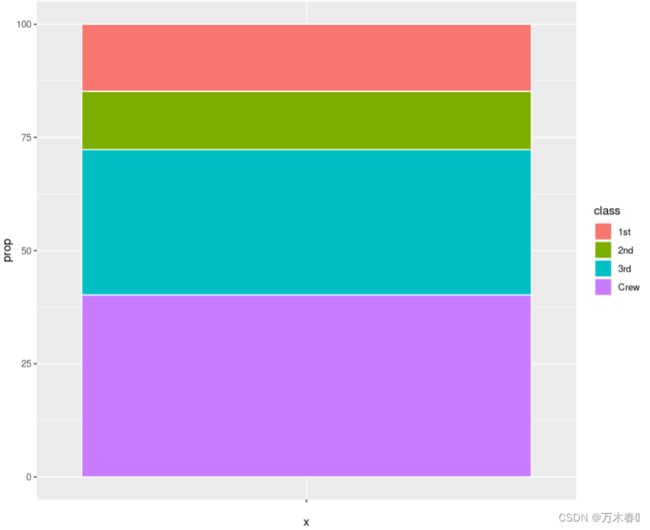
先看一下不转换坐标系的情况:
ggplot(count.data, aes(x = "", y = prop, fill = class)) +
  geom_bar(width = 1, stat = "identity", color = "white")
mycols <- c("#0073C2FF", "#EFC000FF", "#868686FF", "#CD534CFF")

ggplot(count.data, aes(x = "", y = prop, fill = class)) +
  geom_bar(width = 1, stat = "identity", color = "white") +
  coord_polar("y", start = 0)+
  geom_text(aes(y = lab.ypos, label = prop), color = "white")+
  scale_fill_manual(values = mycols) +
  theme_void()
挖一个洞
不再限制柱子的宽度,然后限制一下 X 轴的数值就好了:
ggplot(count.data, aes(x = 2, y = prop, fill = class)) +
  geom_bar(stat = "identity", color = "white") +
  coord_polar(theta = "y", start = 0)+
  geom_text(aes(y = lab.ypos, label = prop), color = "white")+
  scale_fill_manual(values = mycols) +
  theme_void()+
  xlim(0.5, 2.5)
啊
还有个叫南丁格尔玫瑰图的,和这个类似,画图思路也是类似,有机会弄一下……


