Python实验1——网络爬虫及数据可视化
Python实验1——网络爬虫及数据可视化
文章目录
- Python实验1——网络爬虫及数据可视化
- 前言
- 1. 实验目标与基本要求
-
- 1.1 实验目标
- 1.2 基本要求
- 2. 主要知识点、重点与难点
-
- 2.1 主要知识点
- 2.2 重点
- 2.3 难点
- 3. 实验过程设计
-
- 3.1 实验设计流程图
- 3.2 数据获取与处理
-
- 3.2.1 龙虎榜数据
-
- 3.2.1.1 获取网页静态文本
- 3.2.1.2 获取需要的数据
- 3.2.1.3 存储到数据库中
- 3.2.2 个股数据获取与处理
-
- 3.2.2.1 获取网页静态文本
- 3.2.2.2 获取需要的数据
- 3.2.2.3 存储到数据库中
- 3.3 数据的展示
-
- 3.3.1 表格的展示
- 3.3.2 龙虎榜图表
- 3.3.3 股票季度K线图表
- 3.3.4 [通过机器学习进行股票预测](https://www.cnblogs.com/JavaArchitect/p/13489328.html)
- 3.4 GUI界面设计
- 4 优势与不足
-
- 4.1 优势
- 4.2 不足
- 5. 收获与心得
- 4 优势与不足
-
- 4.1 优势
- 4.2 不足
- 5. 收获与心得
前言
本文参考了这篇和那篇,算是综合了这两篇的一些特性吧,给需要做爬虫实验的同学一些参考和学习的资料……
1. 实验目标与基本要求
1.1 实验目标
开发网络爬虫在东方财富、新浪财经或者纳斯达克等财经网站上爬取一只股票的每天的开盘价,收盘价,最高价,最低价等信息,并存储在数据库中,并开发GUI应用可视化。
1.2 基本要求
(1) 掌握网络爬虫的开发方法;
(2) 掌握Python开发数据库的GUI界面;
(3) 掌握Matplotlib绘制股票的K线图;
2. 主要知识点、重点与难点
2.1 主要知识点
(1) 网络爬虫的基本知识;
(2) 利用正则表达式对网页信息提取;
(3) 数据库的访问和表中的数据操作;
(4) Matplotlib库的使用。
2.2 重点
(1) 网络爬虫框架的使用;
(2) 正则表达式的使用;
(3) 数据库存储数据。
2.3 难点
(1) 利用正则表达式根据网页中的信息组织方式提取数据;
(2) K线图的展现。
3. 实验过程设计
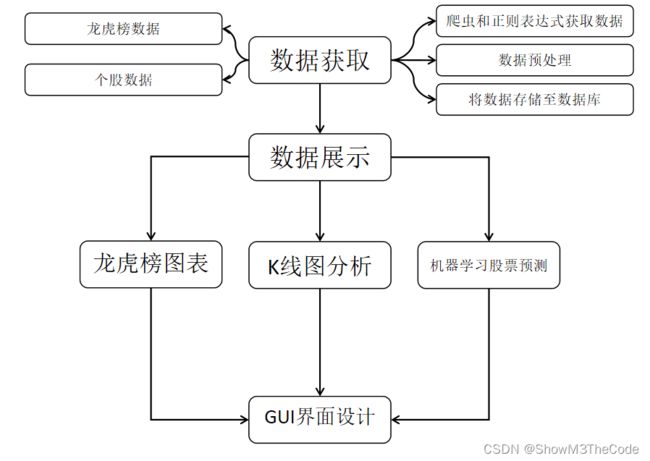
3.1 实验设计流程图
3.2 数据获取与处理
3.2.1 龙虎榜数据
获取龙虎榜数据主要通过以下几个函数:
'''

文件中的函数和简单功能描述:
get_html:           获得一个请求得到的静态网页
get_data:           编写正则表达式获取信息,形成列表
storage:            将爬取的信息存储到数据库中
clear_data:         清洗全局变量
do_lhbProcessment:  启动龙虎榜数据获取与处理

'''
3.2.1.1 获取网页静态文本
# 获取静态网页的文本
def get_html():
    data = requests.get('https://data.eastmoney.com/stock/lhb.html', {"user-agent": "Mozilla/5.0"})
    return data.text
爬取的网站是东方财富的龙虎榜数据,因为不涉及个股,所以直接输入网站即可获取完整的龙虎榜数据。
为了便于下面的数据处理,我们返回网页的静态文本。
3.2.1.2 获取需要的数据
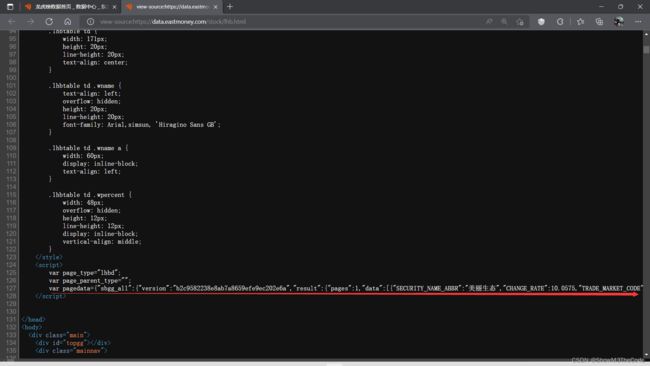
查看网页的源码,我们发现数据存储在head的script中,通过调用soup,我们获取一个含有龙虎榜数据的字符串:
然而,这一行数据中还是有许多我们不需要的信息。所以,我们还要编写正则表达式,对股票名,股票代码,涨跌率等数据进行进一步的爬取,完整代码如下:
# 编写正则表达式获取信息,形成列表
def get_data(text):
    soup = BeautifulSoup(text, "html.parser")
    tmp_list = soup.find("head").find_all("script")[1:]
    tmp_str = tmp_list[0].text[72:]
    print(tmp_str)

    # 获得龙虎榜股票数量
    p1 = r'"count":.+?(?=})'
    match_count = re.search(p1, tmp_str)
    num = int(match_count.group()[8:])
    print(num)

    # 获取龙虎榜更新日期
    p1 = r'"TRADE_DATE":".+?(?= )'
    match_count = re.search(p1, tmp_str)
    global date
    date = match_count.group()[14:]
    print(date)

    # 获取股票名字
    p1 = r'"SECURITY_NAME_ABBR":".+?(?=")'
    match_list1 = re.findall(p1, tmp_str)
    for i in range(num):
        if ' ' in match_list1[i]:
            break
        name_list.append((match_list1[i][22:]))
    print(name_list)

    # 获取股票涨跌率
    p1 = r'"CHANGE_RATE":.+?(?=,)'
    match_list1 = re.findall(p1, tmp_str)
    for i in range(num):
        change_rate_list.append(float(match_list1[i][14:]))
    print(change_rate_list)

    # 获取交易市场代码
    p1 = r'"TRADE_MARKET_CODE":.+?(?=")'
    match_list1 = re.findall(p1, tmp_str)
    for i in range(num):
        trade_market_code_list.append(match_list1[i][21:])
    print(trade_market_code_list)

    # 获取股票代码
    p1 = r'"SECURITY_CODE":.+?(?=")'
    match_list1 = re.findall(p1, tmp_str)
    for i in range(num):
        stock_code_list.append(match_list1[i][17:])
    print(stock_code_list)

    # 获得总的字典列表
    tmp_list1 = []
    tmp_list2 = []
    for i in range(num):
        tmp_dic = {"日期": date, "涨跌率": change_rate_list[i],
                   "交易市场代码": trade_market_code_list[i], "股票代码": stock_code_list[i]}
        if tmp_dic["股票代码"][0] == '8':
            continue
        tmp_dict = {"股票名": name_list[i], "日期": date, "涨跌率": change_rate_list[i],
                    "交易市场代码": trade_market_code_list[i], "股票代码": stock_code_list[i]}
        tmp_list1.append(tmp_dict)
        tmp_list2.append(tmp_dic)
    global total_data_list
    global sql_data_list
    print(total_data_list)
    total_data_list = sorted(tmp_list1, key=lambda list1: -list1["涨跌率"])
    sql_data_list = sorted(tmp_list2, key=lambda list1: -list1["涨跌率"])
3.2.1.3 存储到数据库中
接下来,我们将处理好的数据存入数据库中,利用sqlalchemy的create_engine以及pandas的to_sql,我们可以很方便地实现数据库的存储。
# 存储到数据库中
def storage():
    connect_str = "mysql+pymysql://root:" + password + "@localhost/stockData?charset=utf8"
    con = create_engine(connect_str, echo=True, encoding='utf8')
    df = pd.DataFrame(sql_data_list)
    df.to_sql('lhb-{}'.format(date), con=con, if_exists='replace', index=False)
3.2.2 个股数据获取与处理
获取个股数据主要通过以下几个函数:
'''

文件中的函数和简单功能描述:
get_html:           获得一个请求得到的静态网页
get_data:            将HTML文本转化成字典列表
storage:            将爬取的信息存储到数据库中
data_pretreatment:  为画K线图做数据处理,将五个数据分别放进五个列表中
clear_data:         清洗全局变量
do_DataProcessment: 启动个股数据获取与处理

'''
3.2.2.1 获取网页静态文本
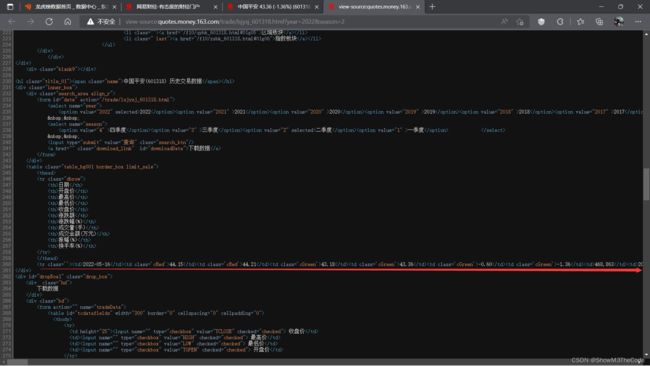
爬取的网站是网易财经的股票历史交易记录。经过观察发现,不同股票历史交易记录的区别在于中间的一段股票代码,然后是年份以及季度,于是通过输入股票代码,年份和季度来获取指定股票的交易网页。(下图以中国平安为例)
为了便于下面的数据处理,我们返回网页的静态文本。
3.2.2.2 获取需要的数据
同样还是以中国平安为例,查看网页的源码,发现所需要的标签存储在inner_box下面的"table_bg001 border_box limit_sale"之中,通过beautifulSoup下面的find()方法即可找到标签。
由于这个网站的数据通过标签分隔开了,我们可以直接通过find_all()来获取数据,无需编取复杂的正则表达式。
# 将HTML文本转化成字典列表
# text: 待处理HTML文本
# total_data_list: 存储{日期,开盘价,收盘价……}信息的字典列表
def get_data(text):
    monthDataList = []
    soup = BeautifulSoup(text, "html.parser")
    tmp_list = soup.find("div", "inner_box").find("table", "table_bg001 border_box limit_sale")
    # print(type(tmp_list))
    data_list = tmp_list.find_all("tr")[1:]
    print(data_list)
    with open("data.txt", "w") as f:
        for item in data_list:
            kv = {}
            tdList = item.find_all("td")
            kv["日期"] = tdList[0].text
            kv["开盘价"] = tdList[1].text
            kv["最高价"] = tdList[2].text
            kv["最低价"] = tdList[3].text
            kv["收盘价"] = tdList[4].text
            kv["成交量"] = tdList[7].text
            monthDataList.append(kv)
            to_write = json.dumps(kv, ensure_ascii=False)
            f.write(to_write)
    global total_data_list
    total_data_list = sorted(monthDataList, key=lambda list1: list1["日期"])
3.2.2.3 存储到数据库中
基本操作与前面的相似,只是将表名修改一下即可。
# 将爬取的信息存储到数据库中
# data: 需要存储的信息
# name: 数据表名
def storage(name, year, quarter):
    print(total_data_list)
    connect_str = "mysql+pymysql://root:" + password + "@localhost/stockData?charset=utf8"
    con = create_engine(connect_str, echo=True)
    df = pd.DataFrame(total_data_list)
    df.to_sql('{}-{}-{}'.format(name, year, quarter), con=con, if_exists='replace', index=False)
3.3 数据的展示
3.3.1 表格的展示
通过上面处理好的数据,我们可以对数据进行展示,其中比较直接的方法就是使用二维表的方式显示数据,我们通过wx.grid.Grid中的表格对象对龙虎榜数据和个股数据在GUI界面进行展示,以下是代码:
    # 生成个股数据表
    def create_grid(self):
        data0 = SingleStockProcessing.total_data_list
        my_list = []
        for item in data0:
            tmp = list(item.values())
            my_list.append(tmp)
        data = my_list
        for row in range(len(data)):
            for col in range(len(data[row])):
                self.grid.SetCellValue(row, col, str(data[row][col]))

    # 生成龙虎榜数据表
    def create_grid1(self):
        data0 = DragonTigerProcessing.total_data_list
        column_names = ['股票名称', '日期', '涨跌率', '交易市场代码', '股票代码']
        my_list = []
        for item in data0:
            tmp = list(item.values())
            my_list.append(tmp)
        data = my_list
        self.grid1 = wx.grid.Grid(parent=self.panel, pos=(50, 130), size=(600, 600))
        self.grid1.CreateGrid(len(data), len(data[0]))
        self.grid1.EnableEditing(False)
        for row in range(len(data)):
            for col in range(len(data[row])):
                self.grid1.SetColLabelValue(col, column_names[col])
                self.grid1.SetCellValue(row, col, str(data[row][col]))
        self.grid1.SetColSize(1, 120)
        self.grid1.SetColSize(3, 140)
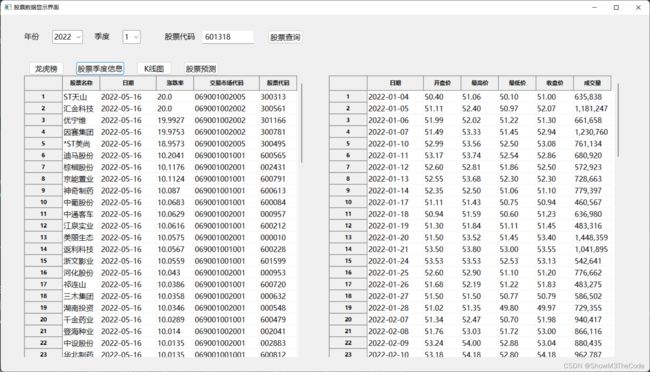
以下是表格数据的示例左边是龙虎榜数据,右边是个股数据:
3.3.2 龙虎榜图表
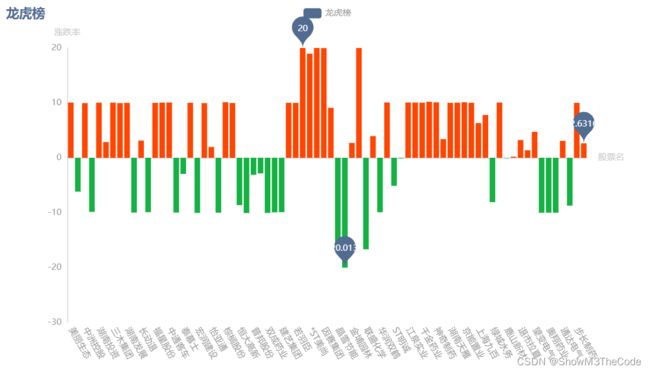
我们将爬取到的龙虎榜数据加工成图表,主要调用的库是pyecharts,为了区分涨跌,使用了JavaScript根据数值大于还是小于0进行不同的着色,代码如下:
# 绘制龙虎榜图表
def draw_lhb():
    tmp1 = []
    tmp2 = []
    l1 = DragonTigerProcessing.name_list
    l2 = DragonTigerProcessing.change_rate_list
    for i in range(len(l1)):
        if DragonTigerProcessing.stock_code_list[i][0] == '8':
            continue
        tmp1.append(l1[i])
        tmp2.append(l2[i])
    bar = (
        Bar(init_opts=opts.InitOpts(theme=ThemeType.WESTEROS))
        .add_xaxis(tmp1)
        .add_yaxis("龙虎榜", tmp2, category_gap=2,
                   itemstyle_opts=opts.ItemStyleOpts(
                       color=JsCode(
                           """
                           function(params) {
                               var colorList;
                               if (params.data >= 0) {
                                   colorList = '#FF4500';
                                   } else {
                                     colorList = '#14b143';
                                   }
                                   return colorList;
                           }
                           """
                       )
                   )
                   )
        .set_global_opts(
            xaxis_opts=opts.AxisOpts(axislabel_opts=opts.LabelOpts(rotate=-60), name="股票名"),
            title_opts=opts.TitleOpts(title="龙虎榜"),
            yaxis_opts=opts.AxisOpts(name="涨跌率"),
        )
        .set_series_opts(
            label_opts=opts.LabelOpts(is_show=False),
            markpoint_opts=opts.MarkPointOpts(
                data=[
                    opts.MarkPointItem(type_="min", name="最小值"),
                    opts.MarkPointItem(type_="max", name="最大值"),
                    opts.MarkPointItem(type_="average", name="平均值"),
                ]
            ),
        )
    )
    bar.render("龙虎图.html")
绘制出的柱状图效果如下:
3.3.3 股票季度K线图表
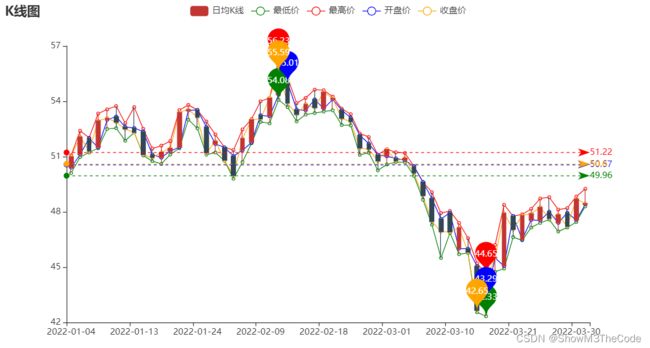
我们将爬取到的个股数据加工成图表,主要调用的库同样是pyecharts,通过overlap()函数实现图线的重叠,可以在一张K线图上同时显示最高价,最低价等信息,方便用户进行查询,代码如下:
# 绘制K线图
def draw_K():
    kline = Kline().set_global_opts(title_opts=opts.TitleOpts(title="K线图"))
    v1 = []
    size = len(SingleStockProcessing.opening_price)  # 有多少条数据(多少天)
    opening_price = SingleStockProcessing.opening_price
    closing_price = SingleStockProcessing.closing_price
    lowest_price = SingleStockProcessing.lowest_price
    highest_price = SingleStockProcessing.highest_price
    date = SingleStockProcessing.date
    for i in range(0, size):
        tmp = [opening_price[i], closing_price[i], lowest_price[i], highest_price[i]]
        v1.append(tmp)  # 整合好一组数据存入v1中
    # print(v1)

    kline.add_yaxis(series_name="日均K线", y_axis=v1)
    kline.add_xaxis([s for s in date])

    c = (
        Line()
        .add_xaxis(date)
        .add_yaxis('最低价', lowest_price, itemstyle_opts=opts.ItemStyleOpts(color='green'))
        .add_yaxis('最高价', highest_price, itemstyle_opts=opts.ItemStyleOpts(color='red'))
        .add_yaxis('开盘价', opening_price, itemstyle_opts=opts.ItemStyleOpts(color='blue'))
        .add_yaxis('收盘价', closing_price, itemstyle_opts=opts.ItemStyleOpts(color='orange'))
        .set_series_opts(
            # 是否显示标签
            label_opts=opts.LabelOpts(is_show=False),
            # 标注点数据项
            markpoint_opts=opts.MarkPointOpts(
                data=[opts.MarkPointItem(type_="max", name="max"),
                      opts.MarkPointItem(type_="min", name="min")]
            ),
            markline_opts=opts.MarkLineOpts
            (data=[opts.MarkLineItem(name="average", type_="average")])
        )
        .set_global_opts(
            xaxis_opts=opts.AxisOpts(name_rotate=-60),
            yaxis_opts=opts.AxisOpts(name="价格:元/股")
        )
    )
    kline.overlap(c)
    kline.render("K线图.html")
绘制出的折线图效果如下:
3.3.4 通过机器学习进行股票预测
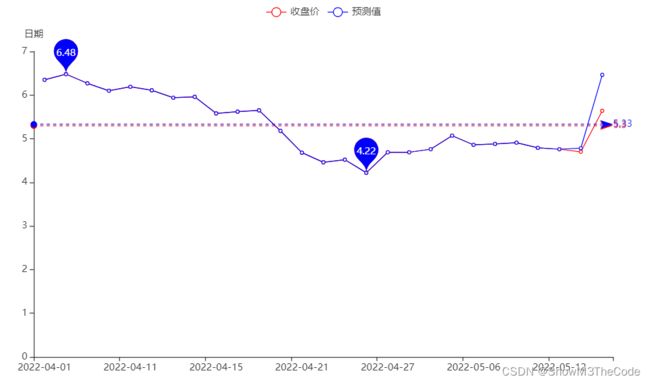
我们将爬取到的个股数据通过sklearn库中的线性回归方法,进行简单的机器学习,其中训练集为一个季度的前95%天,而测试集是后5%天,代码如下:
# 通过机器学习进行股票预测
def do_PredictStockData():
    origDf = pd.DataFrame(SingleStockProcessing.total_data_list)
    predicted_frame = origDf[['开盘价', '最高价', '最低价', '收盘价', '成交量']]
    featureData = predicted_frame[['开盘价', '最高价', '最低价', '成交量']]
    # 划分特征值和目标值
    feature = featureData.values
    for i in range(len(feature)):
        for j in range(len(feature[0])):
            if j == 3:
                print(feature[i][j])
                feature[i][j] = feature[i][j].replace(',', '')
            feature[i][j] = float(feature[i][j])
    print(feature)
    target = np.array(predicted_frame['收盘价'])
    for i in range(len(target)):
        target[i] = float(target[i])
    print(target)

    # 划分训练集,测试集
    feature_train, feature_test, target_train, target_test = train_test_split(feature, target, test_size=0.05)
    predicted_days = int(math.ceil(0.05 * len(origDf)))  # 预测天数
    lrTool = LinearRegression()
    lrTool.fit(feature_train, target_train)     # 训练
    # 用测试集预测结果
    predict_by_test = lrTool.predict(feature_test)
    print(predict_by_test)

    index = 0
    global predicted_list
    predicted_list = []
    while index < len(origDf) - predicted_days:
        predicted_list.append(SingleStockProcessing.closing_price[index])
        index = index + 1
    predicted_cnt = 0

    while predicted_cnt < predicted_days:
        predicted_list.append(predict_by_test[predicted_cnt])
        predicted_cnt = predicted_cnt + 1
        index = index + 1
因为绘制过程和前面两个图标大同小异,这里不再展示绘制的代码,绘制出的预测图效果如下,其中蓝线为预测值,红线为实际的收盘价,可以看出,预测值与收盘价的变化趋势一致,但是数据上估计偏大:
3.4 GUI界面设计
通过调用wx库进行GUI界面的设计,创建一个MyFrame类继承frame然后实现界面设计和按钮逻辑设计,表格展示等功能,因为上面已经展示过界面示例,这里只展示代码:
class MyFrame(wx.Frame):
    flag = False
    data = []
    column_names = []

    # 构造函数,GUI界面设计
    def __init__(self):
        super().__init__(parent=None, title="股票数据显示界面", size=(1400, 800))
        self.grid1 = None
        self.grid = None
        font = wx.Font(pointSize=12, family=wx.FONTFAMILY_DEFAULT,
                       style=wx.FONTSTYLE_NORMAL, weight=wx.FONTWEIGHT_NORMAL, faceName='微软雅黑')
        self.SetFont(font)
        self.Centre()
        self.panel = wx.Panel(parent=self)
        # 上方查询输入设计
        self.year_label = wx.StaticText(parent=self.panel, label='年份', pos=(50, 35))
        self.quarter_label = wx.StaticText(parent=self.panel, label='季度', pos=(200, 35))
        self.stock_code_label = wx.StaticText(parent=self.panel, label='股票代码', pos=(350, 35))
        self.year_combo_box = wx.ComboBox(parent=self.panel,
                                          choices=['2018', '2019', '2020', '2021', '2022'], pos=(110, 33))
        self.quarter_combo_box = wx.ComboBox(parent=self.panel, choices=['1', '2', '3', '4'], pos=(260, 33))
        self.stock_code_ctrl = wx.TextCtrl(parent=self.panel, pos=(430, 33))
        self.post = wx.Button(parent=self.panel, id=1, label='股票查询', pos=(570, 33))

        # 下方查询按钮设计
        self.dragon_tiger_list_button = wx.Button(parent=self.panel, id=2, label='龙虎榜', pos=(60, 100))
        self.stock_quarter_data_button = wx.Button(parent=self.panel, id=3, label='股票季度信息', pos=(160, 100))
        self.Kline_button = wx.Button(parent=self.panel, id=4, label='K线图', pos=(290, 100))
        self.prediction_button = wx.Button(parent=self.panel, id=5, label='股票预测', pos=(390, 100))

        # 将按钮和函数连接
        self.Bind(wx.EVT_BUTTON, self.on_click, self.post)
        self.Bind(wx.EVT_BUTTON, self.on_click, self.dragon_tiger_list_button)
        self.Bind(wx.EVT_BUTTON, self.on_click, self.stock_quarter_data_button)
        self.Bind(wx.EVT_BUTTON, self.on_click, self.Kline_button)
        self.Bind(wx.EVT_BUTTON, self.on_click, self.prediction_button)

        # 开始时显示龙虎榜
        DragonTigerProcessing.do_lhbProcessment()
        self.column_names = ['股票名称', '日期', '涨跌率', '交易市场代码', '股票代码']
        self.rows = 0
        self.create_grid1()

        self.grid = wx.grid.Grid(parent=self.panel, pos=(700, 130), size=(625, 600))
        self.grid.CreateGrid(80, 6)
        self.grid.EnableEditing(False)
        self.grid.SetColSize(0, 120)
        self.column_names = ['日期', '开盘价', '最高价', '最低价', '收盘价', '成交量']
        for i in range(6):
            self.grid.SetColLabelValue(i, self.column_names[i])

    # 按钮逻辑设计
    def on_click(self, event):
        event_id = event.GetId()
        print(event_id)
        if event_id == 1:
            print('股票查询')
            if self.stock_code_ctrl.GetValue()[0] == '8':
                wx.MessageBox("查询失败:无法查询到8开头的股票")
                return
            if self.year_combo_box.GetValue() == '2022' and self.quarter_combo_box.GetValue() > '2':
                wx.MessageBox("查询失败:选择的时间超过显示")
                return
            SingleStockProcessing.do_DataProcessment(self.stock_code_ctrl.GetValue(),
                                                     self.year_combo_box.GetValue(),
                                                     self.quarter_combo_box.GetValue())
            self.data = SingleStockProcessing.total_data_list
            my_list = []
            for item in self.data:
                tmp = list(item.values())
                my_list.append(tmp)
            self.data = my_list
            print(self.data)
            self.flag = True
            wx.MessageBox("查询成功:可以进一步查询股票信息")
        elif event_id == 2:
            print('龙虎榜图表')
            DataDrawing.draw_lhb()
            filename = "龙虎图.html"
            wb.open('file://' + os.path.realpath(filename))
        elif event_id == 3:
            print('股票季度信息')
            if self.flag is False:
                wx.MessageBox("查询失败:请先查询股票信息")
                return
            if self.grid is not None:
                self.grid.ClearGrid()
            self.create_grid()
        elif event_id == 4:
            if self.flag is False:
                wx.MessageBox("查询失败:请先查询股票信息")
                return
            print('K线图')
            DataDrawing.draw_K()
            filename = "K线图.html"
            wb.open('file://' + os.path.realpath(filename))
        elif event_id == 5:
            print('股票预测')
            if self.flag is False:
                wx.MessageBox("查询失败:请先查询股票信息")
                return
            PredictStockData.do_PredictStockData()
            DataDrawing.draw_prediction()
            filename = "预测图.html"
            wb.open('file://' + os.path.realpath(filename))
4 优势与不足
4.1 优势
- 爬取了龙虎榜,这样可以为个股的查询选择提供参考;
- 利用机器学习实现对股票的预测,为股票未来走势提供建议;
- 选用pyecharts来绘制图线,相较于Matplotlib更加美观,交互性更好;
4.2 不足
- 受制于pyecharts只能打开网页,无法嵌入在GUI界面中;
5. 收获与心得
- 第一次用python做一个项目,对python各方面有了全新的认识,对python语言的基础有所巩固;
- 利用爬虫获取网页信息,从中学习到了网络爬虫的相关知识与实现;
- 利用正则表达式提取信息,从中学习到了正则表达式的相关语法与知识;
- 利用to_sql将数据存储到数据库,学习了将IDE环境与数据库相结合的方法;
- 利用pandas进行表格展示,学习了pandas对DataFrame的相关知识与操作方法;
- 利用pyecharts绘制图表,学习了python数据的图表展示方法;
- 利用sklearn对股票走向进行机器学习并给出预测,学了机器学习的相关知识;
- 利用wxPython进行GUI界面设计,学习了python如何设计GUI界面。
