SpringCloud Netflix---Hystrix服务治理
练习代码gitee地址: https://gitee.com/longjiamou/spring-cloud-netflix.git
1. 什么是服务雪崩

一个完整的微服务系统,其实是由很多服务组成的,每个服务之间都多多少少会存在一些依赖关系。如上图所示:假设用户的请求需要通过服务A去调用服务B,服务H再去调用服务N,最后才返回相关的信息,这就是所谓的“扇出”,一个请求需要多个服务之间相互调用才能真正的完成。假如A–>H–>N这个链路出现问题,如:服务H出现错误,导致用户请求堆积在服务A中无法处理,长期累积下去,导致服务占用资源过多,导致整个系统宕机,这就是服务雪崩。
服务雪崩主要是指:由于服务提供者不可用导致服务调用者不可用,并且在生产过程中,这种不可用逐渐扩大,导致系统资源占用过大从而引发一系列的问题的现象。
服务产生雪崩的原因: 服务雪崩产生的原因其实有很多种,大致划分为以下三种:

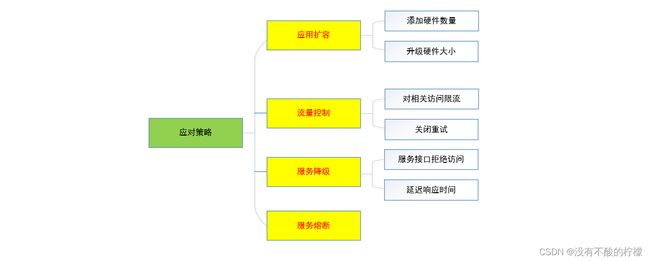
服务雪崩常见解决方式: 常见的解决方式如下:
2. 什么是Hystrix
Hystrix(简称:‘断路器’)是SpringCloud Netflix的一个开源组件库,主要用来处理分布式系统的延迟和容错,在分布式系统中,许多服务之间的依赖调用难免有时候会出现问题从而导致整个服务崩溃等问题,而Hystrix主要是用来解决这种问题的,它提供了隔离,熔断,降级和缓存等方案,能够保证在一个依赖出现问题的情况下,不会导致整个服务全体挂掉,从而提高系统的可用性。
依赖隔离: 隔离主要分为线程池隔离和信号量隔离,常用的为线程池隔离,因为它可以很好的应对突发流量(当用户请求突然增多时,将请求存储在线程池中,然后再慢慢执行)。依赖隔离主要是将每一个服务都配置相对应的线程池,以此来保证当一个服务挂掉后,其他服务可以正常使用。
服务熔断: 当在一定的时间内,服务调用出现的错误达到预定的峰值,服务将会熔断,后续的请求将不会再执行服务中原先的方法,而是直接执行服务降级或者相关的返回方法,当过了一段时间后,用户的请求会再次尝试去调用服务中原先的方法看看是否能正常使用,可以的话则服务正常运行,否则会一直直接执行服务降级方法。
服务降级: 服务降级主要是当服务调用出现错误时,它会先去调用服务中原先的方法,发现此方法出现异常,然后去执行fallback的降级方法。
服务缓存: 当用户的请求发送至服务端时,会先将请求结果缓存,当接下来有相同的请求过来时,直接返回缓存中的请求结果,而不用去执行相关的业务代码逻辑。
3. Hystrix原理
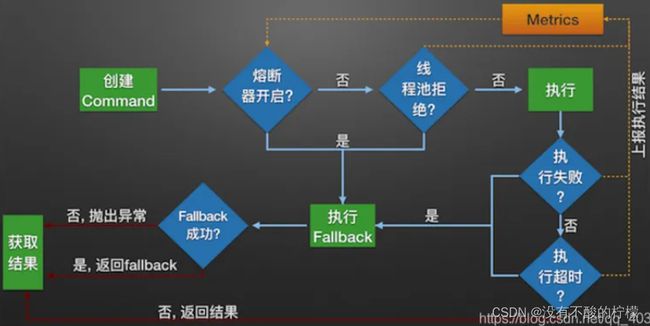
执行流程:
1.通过配置或注解的方式构建Hystrix的Command对象,比如我们在程序中使用的@HystrixCommand注解,调用执行方法
2.Hystrix会检查判断当前Hystrix熔断器是否开启,若开启,则直接执行服务降级逻辑里设定的Fallback方法。
3.若熔断器开关关闭,则Hystrix检查当前熔断器的线程池是否能接收新的请求,若线程池已满则拒绝请求,执行降级熔断逻辑,并上报Metrices(滑动窗口)。
4.若线程池接收请求,则Hystrix调用服务逻辑的run方法。
5.若服务执行失败则执行降级逻辑,并上传Metrices。
6.若服务执行超时则执行降级逻辑,并上传Metrices。
7.若执行成功则直接返回结果。
总结: 当我们构建出HystrixCommand后,程序在运行过程中,先判断服务是否进行了熔断,如果服务熔断了,则直接去调用fallback里设定的方法返回相关的信息,如果服务没有进行熔断,程序会先去执行服务原先的逻辑方法,如果逻辑方法调用成功,则直接返回相关结果,当逻辑方法出现错误(如:读取超时,程序本身出错等等)时,会去调用fallback里设定的方法然后返回相关信息。
4. 服务熔断
当在一定的时间内,服务调用出现的错误达到预定的峰值(默认是在最近的20次请求中出现了50%的错误),服务将会熔断,服务熔断后,请求将会在接下来的5秒内,直接去调用Fallback的方法,当5秒后,Hystrix进入到半开启状态,请求会去执行原先的方法,如果出现错误,Hystrix则会继续直接熔断,否则Hystrix则开启。
服务熔断的特点是:当服务熔断后,将不再调用程序原先的逻辑的方法而是直接去调用相关的降级的方法,直到熔断结束。
Hystrix服务熔断简单入门:
1.搭建好相关的服务: 可参考上篇:https://blog.csdn.net/I_am_fine_/article/details/124310829

2.在server-provide-8083中导入相关依赖和编写测试类
pom依赖导入: 导入Hystrix依赖
<dependency>
    <groupId>org.springframework.cloudgroupId>
    <artifactId>spring-cloud-starter-hystrixartifactId>
    <version>1.4.6.RELEASEversion>
dependency>
编写测试类:

package com.example.controller;

import com.netflix.hystrix.contrib.javanica.annotation.HystrixCommand;
import org.springframework.web.bind.annotation.PostMapping;
import org.springframework.web.bind.annotation.RestController;

@RestController
public class testController {

    @PostMapping("/test")
    @HystrixCommand(fallbackMethod = "test01")
    public String test(String id){
        //设置id为空值时,模拟程序出错,抛出异常,以便服务熔断调用备选方法
        if(id == "") {
            throw new RuntimeException("id为空,模拟服务方法出现错误生效");
        }
        System.out.println("执行了原先的方法");
        return "传入了ID存在,服务正常运行";
    }

    //服务调用出错时的备选方法
    public String test01(String id){
        return id+":原先方法出现错误,服务开始调用备选方法";
    }
}
启动类添加相关注解:
package com.example;

import org.springframework.boot.SpringApplication;
import org.springframework.boot.autoconfigure.SpringBootApplication;
import org.springframework.cloud.client.circuitbreaker.EnableCircuitBreaker;
import org.springframework.cloud.client.discovery.EnableDiscoveryClient;
import org.springframework.cloud.netflix.eureka.EnableEurekaClient;


@SpringBootApplication
@EnableEurekaClient
@EnableDiscoveryClient
@EnableCircuitBreaker
public class ServerProvide8083Application {
    public static void main(String[] args) {
        SpringApplication.run(ServerProvide8083Application.class, args);
    }
}
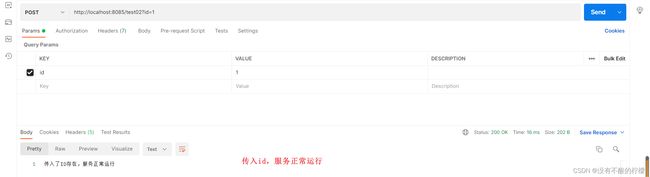
3.启动注册中心,服务提供者,服务消费者,然后进行测试:

5. 服务降级
服务降级主要是人为去干预服务的运行情况,当服务在运行过程中,出现一个服务调用频繁,一个服务相对空闲的情况,我们可以去相对减少相对空闲的那个服务的资源,将更多的资源给调用频繁的那个服务,保证系统的顺利进行。
服务降级与服务熔断的区别在于:服务降级无论什么情况下都会先去尝试调用程序本身的方法而不是直接去调用fallback的方法,而服务熔断的话,则是直接去调用fallback里的方法。
简单入门:
在Hystrix中,服务降级主要在服务消费里配置。
1.在服务消费者里配置相关的降级信息
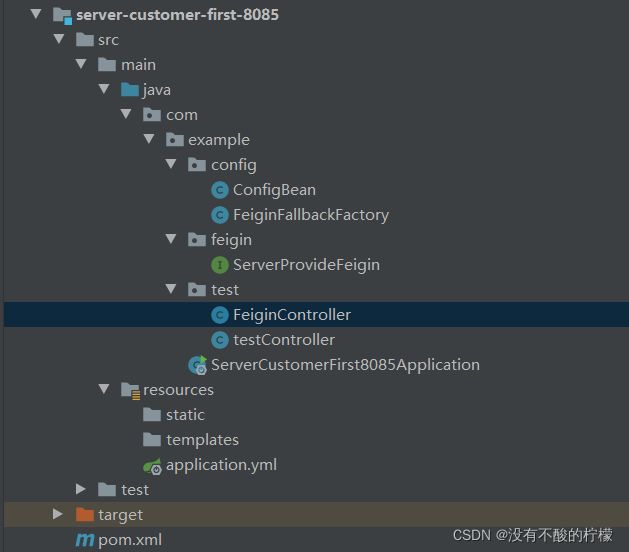
编写FeiginFallbackFactory: 主要实现FallbackFactory接口,并设置相对应的降级方法
package com.example.config;

import com.example.feigin.ServerProvideFeigin;
import feign.hystrix.FallbackFactory;
import org.springframework.stereotype.Component;

//服务降级
@Component
public class FeiginFallbackFactory implements FallbackFactory {
    public ServerProvideFeigin create(Throwable throwable) {
        return new ServerProvideFeigin() {
            public String test(String id) {
                return "服务提供者挂掉了,服务异常";
            }
        };
    }
}
配置Feigin调用类: 指定降级方法的对应类
package com.example.feigin;

import com.example.config.FeiginFallbackFactory;
import org.springframework.cloud.openfeign.FeignClient;
import org.springframework.stereotype.Component;
import org.springframework.web.bind.annotation.GetMapping;
import org.springframework.web.bind.annotation.PostMapping;
import org.springframework.web.bind.annotation.RequestParam;

@Component
@FeignClient(value = "SERVER-PROVIDER",fallbackFactory = FeiginFallbackFactory.class)
public interface ServerProvideFeigin {

    //定义服务提供者所提供的接口(controller层,注意:访问地址和接口名要一致)
    @PostMapping("/test")
    public String test(@RequestParam("id") String id);
}
修改application配置类: 开启Hystrix,因为feigin对Hystrix做了集成处理
server:
  port: 8085

eureka:
  client:
    service-url:
      defaultZone: http://localhost:8081/eureka/,http://localhost:8082/eureka/
    register-with-eureka: false
spring:
  application:
    name: server-customer-first-8085

feign:
  hystrix:
    enabled: true
启动测试: 启动服务注册中心和服务消费者即可,模拟服务提供者宕机

6. 服务监控
Hystrix提供了一个监控面板Hystrix Dashboard来对服务进行实时监控,在这个模板里,我们可以观察服务的实时状态,比如:服务请求成功率,服务健康指数等等。
简单使用:
1.搭建服务监控服务HystrixDashboard
pom依赖: 主要是添加Hystrix和Hystrix-dashboard两个依赖
<project xmlns="http://maven.apache.org/POM/4.0.0" xmlns:xsi="http://www.w3.org/2001/XMLSchema-instance"
         xsi:schemaLocation="http://maven.apache.org/POM/4.0.0 https://maven.apache.org/xsd/maven-4.0.0.xsd">
    <modelVersion>4.0.0modelVersion>
    <parent>
        <groupId>com.examplegroupId>
        <artifactId>springcloud-netfilxartifactId>
        <version>1.0-SNAPSHOTversion>
        <relativePath/>
    parent>

    <artifactId>hystrix-dashboardartifactId>

    <properties>
        <java.version>1.8java.version>
    properties>

    <dependencies>

        <dependency>
            <groupId>org.springframework.cloudgroupId>
            <artifactId>spring-cloud-starter-hystrixartifactId>
            <version>1.4.6.RELEASEversion>
        dependency>


        <dependency>
            <groupId>org.springframework.cloudgroupId>
            <artifactId>spring-cloud-starter-hystrix-dashboardartifactId>
            <version>1.4.6.RELEASEversion>
        dependency>


        <dependency>
            <groupId>org.springframework.cloudgroupId>
            <artifactId>spring-cloud-starter-eurekaartifactId>
            <version>1.4.6.RELEASEversion>
        dependency>


        <dependency>
            <groupId>org.springframework.cloudgroupId>
            <artifactId>spring-cloud-starter-ribbonartifactId>
            <version>1.4.6.RELEASEversion>
        dependency>


        <dependency>
            <groupId>org.springframework.cloudgroupId>
            <artifactId>spring-cloud-starter-feignartifactId>
            <version>1.4.6.RELEASEversion>
        dependency>

        <dependency>
            <groupId>org.springframework.bootgroupId>
            <artifactId>spring-boot-starter-webartifactId>
        dependency>

        <dependency>
            <groupId>org.springframework.bootgroupId>
            <artifactId>spring-boot-starterartifactId>
        dependency>

        <dependency>
            <groupId>org.springframework.bootgroupId>
            <artifactId>spring-boot-starter-testartifactId>
            <scope>testscope>
        dependency>
    dependencies>

project>
启动类配置:
package com.example;

import org.springframework.boot.SpringApplication;
import org.springframework.boot.autoconfigure.SpringBootApplication;
import org.springframework.cloud.netflix.hystrix.dashboard.EnableHystrixDashboard;

@SpringBootApplication
@EnableHystrixDashboard
public class HystrixDashboardApplication {
    public static void main(String[] args) {
        SpringApplication.run(HystrixDashboardApplication.class, args);
    }
}
application配置文件:
server:
  port: 8086

eureka:
  client:
    service-url:
      defaultZone: http://localhost:8081/eureka/,http://localhost:8082/eureka/

spring:
  application:
    name: hystrix-dashboard

hystrix:
  dashboard:
    proxy-stream-allow-list: "*"
测试是否配置成功: 访问 http://localhost:8086/hystrix

2.配置被监控的服务server-provide-8083
pom依赖: 主要添加服务监控actuator
<dependency>
    <groupId>org.springframework.bootgroupId>
    <artifactId>spring-boot-starter-actuatorartifactId>
    <version>1.5.16.RELEASEversion>
dependency>
启动类配置:
package com.example;

import com.netflix.hystrix.contrib.metrics.eventstream.HystrixMetricsStreamServlet;
import com.netflix.hystrix.metric.consumer.HystrixDashboardStream;
import org.springframework.boot.SpringApplication;
import org.springframework.boot.autoconfigure.SpringBootApplication;
import org.springframework.boot.web.servlet.ServletRegistrationBean;
import org.springframework.cloud.client.circuitbreaker.EnableCircuitBreaker;
import org.springframework.cloud.client.discovery.EnableDiscoveryClient;
import org.springframework.cloud.netflix.eureka.EnableEurekaClient;
import org.springframework.cloud.netflix.hystrix.dashboard.EnableHystrixDashboard;
import org.springframework.context.annotation.Bean;


@SpringBootApplication
@EnableEurekaClient
@EnableDiscoveryClient
@EnableCircuitBreaker
@EnableHystrixDashboard
public class ServerProvide8083Application {

    public static void main(String[] args) {
        SpringApplication.run(ServerProvide8083Application.class, args);
    }

    //添加一个servlet给监控页面来监控,配置监控路径
    @Bean
    public ServletRegistrationBean HystrixDashboard(){
        ServletRegistrationBean registrationBean = new ServletRegistrationBean(new HystrixMetricsStreamServlet());
        registrationBean.addUrlMappings("/actuator/hystrix.stream");
        return registrationBean;
    }
}
3.在监控页面输入这个服务监控地址:http://localhost:8083/actuator/hystrix.stream
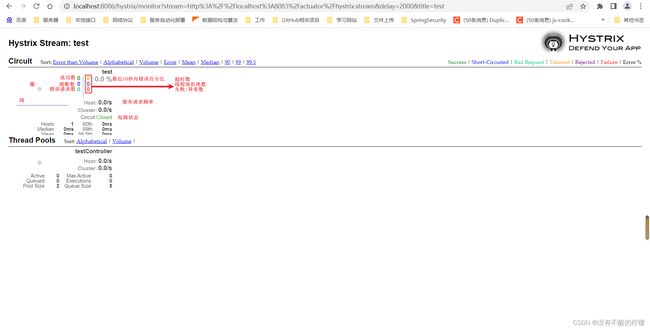
圈: 有俩种含义,大小:流量越大,访问次数越多,他的大小就越大;颜色:代表健康状态,绿色>黄色>橙色>红色,安全程度递减
线: 用来记录2分钟内流量的相对变化,观察流量的上升和下降趋势