分段插值方法和code,cubic spline, cubic hermite spline
文章目录
-
- 0. 引入
- 1.Cubic Spline Interpolation
- 2. 多项式插值
- 3. 分段插值
- 4. scipy.interpolate中的插值方法
-
- 4.1 cubic hermite spline插值类
- 4.2 cubic spline插值类
- 4.3 示例和代码:
0. 引入
在 Non-Rigid Dense Correspondence with Applications for Image Enhancement 和 Exposure Stacks of Live Scenes with Hand-Held Cameras中 使用了分段函数拟合的方法: cubic spline 和 cubic hermite spline。
cubic是三次插值函数,每一段都是cubic函数,连接在一起构成spline.
1.Cubic Spline Interpolation
Cubic Spline Interpolation清晰的讲解和python示例
from scipy.interpolate import CubicSpline
import numpy as np
import matplotlib.pyplot as plt

plt.style.use('seaborn-poster')
x = [0, 1, 2]
y = [1, 3, 2]

# use bc_type = 'natural' adds the constraints as we described above
f = CubicSpline(x, y, bc_type='natural')
x_new = np.linspace(0, 2, 100)
y_new = f(x_new)
plt.figure(figsize = (10,8))
plt.plot(x_new, y_new, 'b')
plt.plot(x, y, 'ro')
plt.title('Cubic Spline Interpolation')
plt.xlabel('x')
plt.ylabel('y')
plt.show()
2. 多项式插值
多项式插值,顾名思义,即以一个多项式的形式来刻画经过一系列点的曲线。
比如拉格朗日插值 和牛顿插值,无论是Lagrange插值还是Newton插值,本质都是用一个多项式来进可能精确地描绘过节点的原始函数。但多项式插值的矛盾之处在于,若节点太少,则插值出来的函数与原始函数可能偏离较大,返回的插值结果对于实际的指导用处不大;但若节点太多,则多项式的阶数也会需要相应增加,但太高的阶数容易又会导致绘制出的插值曲线在边缘处不稳定,这便是龙格现象
不同插值方法的比较及Python实现
3. 分段插值
多项式插值容易产生龙格现象,这时候可以使用分段插值。
常见的分段插值主要有分段线性插值,分段三次Hermite插值以及分段三次样条插值。
下面的博客介绍的很清楚:
参考
1.不同插值方法的比较及Python实现
2. Cubic Hermite Spline之二
3. 可以指定函数值和斜率的cubic hermite spline python lib
from chspy import CubicHermiteSpline
from matplotlib.pyplot import subplots

spline = CubicHermiteSpline(n=3)

#            time   state    slope
spline.add((   0 , [1,3,0], [0,1,0] ))
spline.add((   1 , [3,2,0], [0,4,0] ))
spline.add((   4 , [0,1,3], [0,4,0] ))

fig,axes = subplots(figsize=(7,2))
spline.plot(axes)
axes.set_xlabel("time")
axes.set_ylabel("state")
fig.legend(loc="right",labelspacing=1)
fig.subplots_adjust(right=0.7)
4. Monotone Cubic Interpolation单调的分段插值code
4. scipy.interpolate中的插值方法
4.1 cubic hermite spline插值类
class scipy.interpolate.CubicHermiteSpline
class scipy.interpolate.PchipInterpolator 单调
4.2 cubic spline插值类
class scipy.interpolate.CubicSpline
class scipy.interpolate.Akima1DInterpolator 完全通过给的点
Akima1DInterpolator拟合分段三次多项式,给定向量x和y。生成的曲线通过给定的数据点,看起来平滑自然。
仅用于精确的数据,因为拟合曲线精确地通过给定的点。
'''
cubic hermite :节点处一阶导数相等
cubic :节点处二阶导数相等,因此更加平滑,更加扭曲
Akima1DInterpolator : cubic 分段插值,但是拟合的曲线会通过给定点
PchipInterpolator :monotonic cubic hermite ,在分段区间内都是单调的。
'''
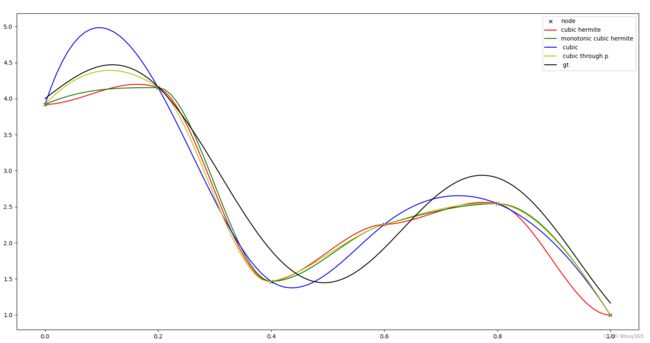
4.3 示例和代码:
gt是groundtruth 曲线
node是生成的带噪声的点
其他是使用上面4个函数拟合得到曲线。
"""
分段函数拟合
"""
import numpy as np
import scipy
from matplotlib import pyplot as plt

def fun(xx, fig=0):
    # xx = np.linspace(0, 1, 100)
    yy1 = np.sin(xx * 10)
    yy2 = (xx - 2) ** 2 * np.sqrt(xx ** 4 + 1)
    yy3 = xx / 10.4 * np.log(20 * xx ** 2 + 1)

    yy = yy1 + yy2 + yy3
    if fig:
        plt.figure()
        plt.plot(xx, yy1, 'r-', xx, yy2, 'g-', xx, yy3, 'b-', xx, yy, 'k-')
        plt.show()
    return yy
if __name__ == "__main__":
    xx = np.linspace(0, 1, 100)
    yy = fun(xx, 1)

    np.random.seed(2)
    xx1 = np.linspace(0, 1, 6)
    yy1 = fun(xx1) + np.random.randn(len(xx1)) * 0.2
    plt.figure()
    plt.plot(xx1, yy1, 'r+', xx, yy, 'k-')
    plt.show()

    dy = np.zeros_like(yy1)
    dy[:-1] = yy1[1:] - yy1[:-1]
    interp_1 = scipy.interpolate.CubicHermiteSpline(xx1, yy1, dy )
    yy_pred_1 = interp_1(xx)

    interp_1 = scipy.interpolate.PchipInterpolator(xx1, yy1)
    yy_pred_2 = interp_1(xx)

    interp_1 = scipy.interpolate.CubicSpline(xx1, yy1)
    yy_pred_3 = interp_1(xx, 0)

    interp_1 = scipy.interpolate.Akima1DInterpolator(xx1, yy1)
    yy_pred_4 = interp_1(xx)

    plt.figure()
    plt.plot(xx1, yy1, 'kx', label='node')
    plt.plot( xx, yy_pred_1, 'r-', label='cubic hermite')
    plt.plot( xx, yy_pred_2, 'g-', label='monotonic cubic hermite')
    plt.plot( xx, yy_pred_3, 'b-', label=' cubic ')
    plt.plot(xx, yy_pred_4, 'y-', label=' cubic through p')
    plt.plot(xx, yy, 'k-', label=' gt')
    plt.legend()
    plt.show()
    '''
    cubic hermite :节点处一阶导数相等
    cubic :节点处二阶导数相等,因此更加平滑,更加扭曲
    Akima1DInterpolator : cubic 分段插值,但是拟合的曲线会通过给定点
    PchipInterpolator :monotonic cubic hermite ,在分段区间内都是单调的。
    '''


