1)线性回归模型
import numpy as np
import pandas as pd
from matplotlib import pyplot as plt
import torch
from torch import nn
import torch.nn.functional as F
from torch.utils.data import Dataset,DataLoader,TensorDataset
n = 400
X = 10*torch.rand([n,2])-5.0
w0 = torch.tensor([[2.0],[-3.0]])
b0 = torch.tensor([[10.0]])
Y = X@w0 + b0 + torch.normal( 0.0,2.0,size = [n,1])
ds = TensorDataset(X,Y)
ds_train,ds_valid = torch.utils.data.random_split(ds,[int(400*0.7),400-int(400*0.7)])
dl_train = DataLoader(ds_train,batch_size = 10,shuffle=True,num_workers=2)
dl_valid = DataLoader(ds_valid,batch_size = 10,num_workers=2)
from torchkeras import Model
class LinearRegression(Model):
def __init__(self):
super(LinearRegression, self).__init__()
self.fc = nn.Linear(2,1)
def forward(self,x):
return self.fc(x)
model = LinearRegression()
def mean_absolute_error(y_pred,y_true):
return torch.mean(torch.abs(y_pred-y_true))
def mean_absolute_percent_error(y_pred,y_true):
absolute_percent_error = (torch.abs(y_pred-y_true)+1e-7)/(torch.abs(y_true)+1e-7)
return torch.mean(absolute_percent_error)
model.compile(loss_func = nn.MSELoss(),
optimizer= torch.optim.Adam(model.parameters(),lr = 0.01),
metrics_dict={"mae":mean_absolute_error,"mape":mean_absolute_percent_error})
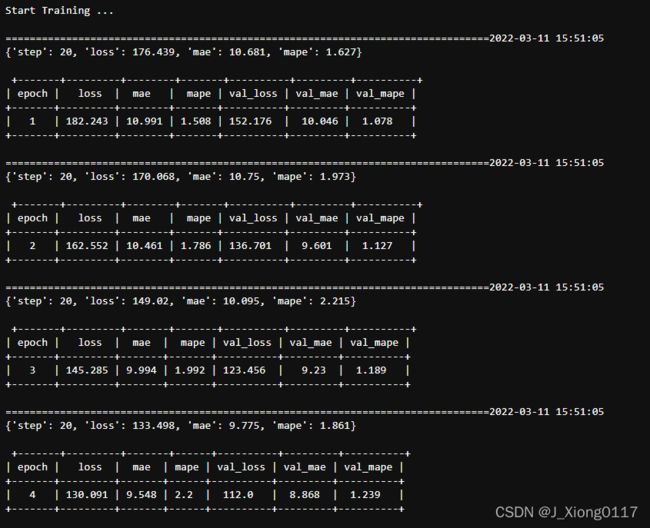
dfhistory = model.fit(200,dl_train = dl_train, dl_val = dl_valid,log_step_freq = 20)

w,b = model.state_dict()["fc.weight"],model.state_dict()["fc.bias"]

plt.figure(figsize = (12,5))
ax1 = plt.subplot(121)
ax1.scatter(X[:,0],Y[:,0], c = "b",label = "samples")
ax1.plot(X[:,0],w[0,0]*X[:,0]+b[0],"-r",linewidth = 5.0,label = "model")
ax1.legend()
plt.xlabel("x1")
plt.ylabel("y",rotation = 0)


ax2 = plt.subplot(122)
ax2.scatter(X[:,1],Y[:,0], c = "g",label = "samples")
ax2.plot(X[:,1],w[0,1]*X[:,1]+b[0],"-r",linewidth = 5.0,label = "model")
ax2.legend()
plt.xlabel("x2")
plt.ylabel("y",rotation = 0)

plt.show()

dfhistory.tail()

import matplotlib.pyplot as plt

def plot_metric(dfhistory, metric):
    train_metrics = dfhistory[metric]
    val_metrics = dfhistory['val_'+metric]
    epochs = range(1, len(train_metrics) + 1)
    plt.plot(epochs, train_metrics, 'bo--')
    plt.plot(epochs, val_metrics, 'ro-')
    plt.title('Training and validation '+ metric)
    plt.xlabel("Epochs")
    plt.ylabel(metric)
    plt.legend(["train_"+metric, 'val_'+metric])
    plt.show()

plot_metric(dfhistory,"loss")

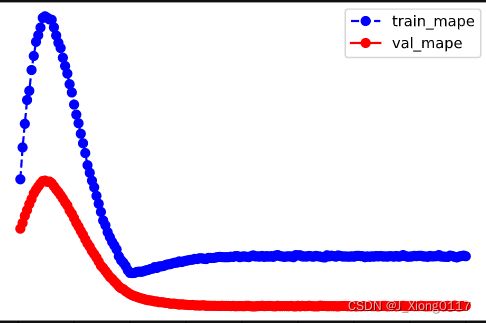
plot_metric(dfhistory,"mape")

2)DNN二分类模型
import numpy as np
import pandas as pd
from matplotlib import pyplot as plt
import torch
from torch import nn
import torch.nn.functional as F
from torch.utils.data import Dataset,DataLoader,TensorDataset
import torchkeras
%matplotlib inline
%config InlineBackend.figure_format = 'svg'
n_positive,n_negative = 2000,2000
r_p = 5.0 + torch.normal(0.0,1.0,size = [n_positive,1])
theta_p = 2*np.pi*torch.rand([n_positive,1])
Xp = torch.cat([r_p*torch.cos(theta_p),r_p*torch.sin(theta_p)],axis = 1)
Yp = torch.ones_like(r_p)
r_n = 8.0 + torch.normal(0.0,1.0,size = [n_negative,1])
theta_n = 2*np.pi*torch.rand([n_negative,1])
Xn = torch.cat([r_n*torch.cos(theta_n),r_n*torch.sin(theta_n)],axis = 1)
Yn = torch.zeros_like(r_n)
X = torch.cat([Xp,Xn],axis = 0)
Y = torch.cat([Yp,Yn],axis = 0)
ds = TensorDataset(X,Y)
ds_train,ds_valid = torch.utils.data.random_split(ds,[int(len(ds)*0.7),len(ds)-int(len(ds)*0.7)])
dl_train = DataLoader(ds_train,batch_size = 100,shuffle=True,num_workers=2)
dl_valid = DataLoader(ds_valid,batch_size = 100,num_workers=2)
class Net(nn.Module):
def __init__(self):
super().__init__()
self.fc1 = nn.Linear(2,4)
self.fc2 = nn.Linear(4,8)
self.fc3 = nn.Linear(8,1)
def forward(self,x):
x = F.relu(self.fc1(x))
x = F.relu(self.fc2(x))
y = nn.Sigmoid()(self.fc3(x))
return y
model = torchkeras.Model(Net())
model.summary(input_shape =(2,))
def accuracy(y_pred,y_true):
y_pred = torch.where(y_pred>0.5,torch.ones_like(y_pred,dtype = torch.float32),
torch.zeros_like(y_pred,dtype = torch.float32))
acc = torch.mean(1-torch.abs(y_true-y_pred))
return acc
model.compile(loss_func = nn.BCELoss(),optimizer= torch.optim.Adam(model.parameters(),lr = 0.01),
metrics_dict={"accuracy":accuracy})
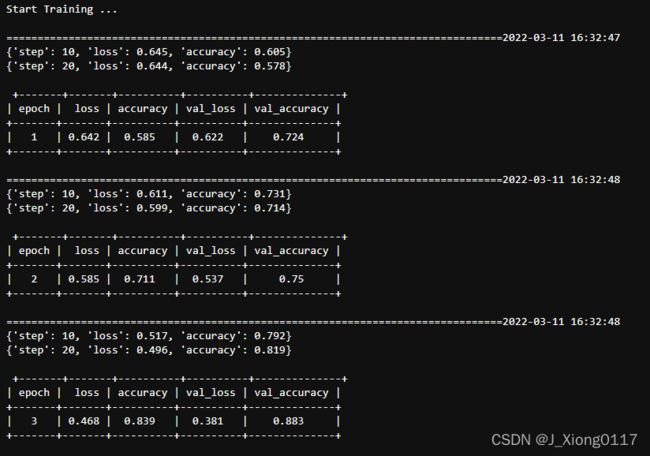
dfhistory = model.fit(100,dl_train = dl_train,dl_val = dl_valid,log_step_freq = 10)

fig, (ax1,ax2) = plt.subplots(nrows=1,ncols=2,figsize = (12,5))
ax1.scatter(Xp[:,0],Xp[:,1], c="r")
ax1.scatter(Xn[:,0],Xn[:,1],c = "g")
ax1.legend(["positive","negative"]);
ax1.set_title("y_true");
Xp_pred = X[torch.squeeze(model.forward(X)>=0.5)]
Xn_pred = X[torch.squeeze(model.forward(X)<0.5)]
ax2.scatter(Xp_pred[:,0],Xp_pred[:,1],c = "r")
ax2.scatter(Xn_pred[:,0],Xn_pred[:,1],c = "g")
ax2.legend(["positive","negative"]);
ax2.set_title("y_pred");

import matplotlib.pyplot as plt
def plot_metric(dfhistory, metric):
train_metrics = dfhistory[metric]
val_metrics = dfhistory['val_'+metric]
epochs = range(1, len(train_metrics) + 1)
plt.plot(epochs, train_metrics, 'bo--')
plt.plot(epochs, val_metrics, 'ro-')
plt.title('Training and validation '+ metric)
plt.xlabel("Epochs")
plt.ylabel(metric)
plt.legend(["train_"+metric, 'val_'+metric])
plt.show()
plot_metric(dfhistory,"loss")

plot_metric(dfhistory,"accuracy")


