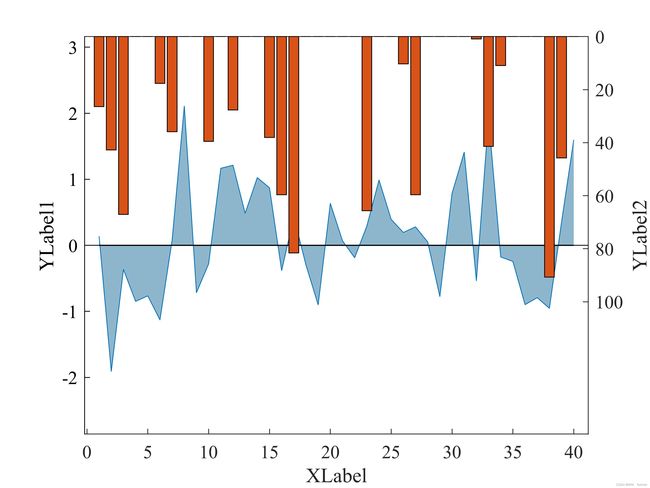
MATLAB绘制双轴-倒立柱状图
成图如下:

MATLAB代码如下:
clc
close all
clear
%% 导入数据
pathFigure= '.\Figures\' ;

X = randn(40,1);
Ymax = 50;
Y = Ymax*randn(40,1);

%% 开始绘图
figure(1)
hold on;box on;grid off;
h(3) = area( X,'FaceColor', [0.5529,0.7137,0.8039] ,'LineStyle','none');
[AX,h(1),h(2)] = plotyy( 1:length(X), X, 1:length(X) , Y, 'plot','bar');              % 画双轴,AX(1)左轴,AX(2)右轴,H为曲线本身
set(AX(2),'YDir','reverse','Ylim',[0, Ymax*3 ],'YTick',[0:20:Ymax*2],'FontSize',12,'Fontname', 'Times New Roman');                    % 设置右边轴为倒立
set(gca,'box','off','Ytick',[])
set(AX(1),'YLim',[min(X)*1.5,1.5*max(X)],'YTick',[floor(min(X)*1.5):1:ceil(1.5*max(X)) ],'Fontsize',10,'YColor','k');
%设置坐标轴的标题
h(5) = plot( zeros( length(X) ,1) ,'k-','linewidth',0.75);
set(get(AX(1),'Xlabel'),'String','XLabel','Fontname', 'Times New Roman');
set(get(AX(1),'Ylabel'),'String','YLabel1','Fontname', 'Times New Roman');
set(get(AX(2),'Ylabel'),'string','YLabel2','LineStyle','none','Fontname', 'Times New Roman');
set(gca,'Layer','top','FontSize',12,'Fontname', 'Times New Roman');

str= strcat(pathFigure, "Figure 1", '.jpg');
print(gcf, '-djpeg', '-r600', str);
参考
