go-prometheus业务监控指标实战(一)
go-prometheus业务监控指标实战(一)
prometheus简介
Prometheus 是一个使用go语言编写的开源系统监控和告警工具包,其开发者和用户社区非常活跃,在GitHub现在是一个独立的开源项目,prometheus生态非常丰富,已经衍生出很多工具包,其中大部分都是用go语言编写的。主要有 Prometheus Server 作为服务端,用来存储时间序列数据。Exporter 用来监控 HAProxy,StatsD,Graphite 等特殊的监控目标,并向 Prometheus 提供标准格式的监控样本数据。alartmanager 用来处理告警。除此之外,官方还提供了各种语言的sdk进行接入,python,java,go等
参考学习资料
官方文档
中文文档
go_client文档
代码地址
gitee
prometheus安装
安装说明
- 版本:prometheus-2.35.0
- 机器:ubuntu虚拟机,通过静态ip 192.168.64.2 和本机相连

- 使用静态ip
- 端口占用,默认是9090
安装
下载-地址(不同操作系统包不同)
wget https://github.com/prometheus/prometheus/releases/download/v2.35.0/prometheus-2.35.0.linux-amd64.tar.gz
解压
tar -zxvf prometheus-2.35.0.linux-amd64.tar.gz
当前目录结构
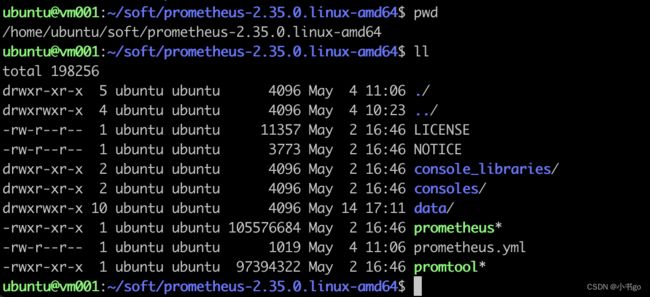
配置文件 prometheus.yml
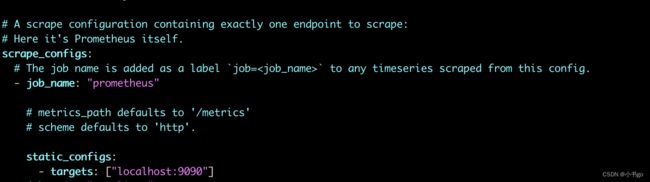
主要关注这一块,job_name即任务名,不重复就行,默认prometheus会有一个任务就是,监控当前自己这个server实例的信息,监控指标的采集方式就是通过 targets 中配置的url地址 path默认是 /metrics
启动
./prometheus --config.file=prometheus.yml
验证
- http://192.168.64.2:9090/metrics 可正常访问,该页面为prometheus采集监控指标的url
- http://192.168.64.2:9090/ 可以访问到prometheus提供的web界面
如果出现访问不通的情况,可以检查是否是防火墙拦截的相应端口,如果你使用的是云服务器,查看一下是否是安全组没有开对应端口的策略
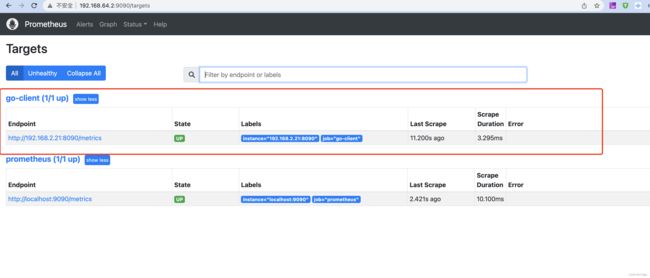
web界面简单介绍
此处标识当前这台 server 采集了哪几个job,就是在上面prometheus.yml 配置文件中进行配置的

此界面可以对采集到的监控指标进行图表绘制

模型-指标类型介绍
模型
Prometheus 所有采集的监控数据均以指标(metric)的形式保存在内置的时间序列数据库当中(TSDB):属于同一指标名称,同一标签集合的、有时间戳标记的数据流。除了存储的时间序列,Prometheus 还可以根据查询请求产生临时的、衍生的时间序列作为返回结果。
在时间序列中的每一个点称为一个样本(sample),样本由以下三部分组成
- 指标(metric):指标名称和描述当前样本特征的 labelsets;
- 时间戳(timestamp):一个精确到毫秒的时间戳;
- 样本值(value): 一个 folat64 的浮点型数据表示当前样本的值。
指标类型
Prometheus 的客户端库中提供了四种核心的指标类型。但这些类型只是在客户端库(客户端可以根据不同的数据类型调用不同的 API 接口)和在线协议中,实际在 Prometheus server 中并不对指标类型进行区分,而是简单地把这些指标统一视为无类型的时间序列。
Counter 计数器
Counter 类型代表一种样本数据单调递增的指标,即只增不减。除非监控系统发生了重置。例如,你可以使用 counter 类型的指标来表示服务的请求数、已完成的任务数、错误发生的次数等。不要将 counter 类型应用于样本数据非单调递增的指标,例如:当前运行的进程数量(应该用 Gauge 类型)。
Gauge 仪表盘
Gauge 类型代表一种样本数据可以任意变化的指标,即可增可减。Gauge 通常用于像温度或者内存使用率这种指标数据,也可以表示能随时增加或减少的“总数”,例如:当前并发请求的数量。
Histogram 直方图
在大多数情况下人们都倾向于使用某些量化指标的平均值,例如 CPU 的平均使用率、页面的平均响应时间。这种方式的问题很明显,以系统 API 调用的平均响应时间为例:如果大多数 API 请求都维持在 100ms 的响应时间范围内,而个别请求的响应时间需要 5s,那么就会导致某些 WEB 页面的响应时间落到中位数的情况,而这种现象被称为长尾问题。
为了区分是平均的慢还是长尾的慢,最简单的方式就是按照请求延迟的范围进行分组。例如,统计延迟在 0~10ms 之间的请求数有多少而 10~20ms 之间的请求数又有多少。通过这种方式可以快速分析系统慢的原因。Histogram 和 Summary 都是为了能够解决这样问题的存在,通过 Histogram 和 Summary 类型的监控指标,我们可以快速了解监控样本的分布情况。
Histogram 在一段时间范围内对数据进行采样(通常是请求持续时间或响应大小等),并将其计入可配置的存储桶(bucket)中,后续可通过指定区间筛选样本,也可以统计样本总数,最后一般将数据展示为直方图。
Histogram 类型的样本会提供三种指标(假设指标名称为
- 样本的值分布在 bucket 中的数量,命名为
_bucket{le=“<上边界>”}。解释的更通俗易懂一点,这个值表示指标值小于等于上边界的所有样本数量。 请求响应时间 <=0.005 秒 的请求次数。 - 所有样本值的大小总和,命名为
_sum:所有请求响应时间总和 - 样本总数,命名为
_count。值和 _bucket{le=“+Inf”} 相同。所有请求次数
Summary 摘要
与 Histogram 类型类似,用于表示一段时间内的数据采样结果(通常是请求持续时间或响应大小等),但它直接存储了分位数(通过客户端计算,然后展示出来),而不是通过区间来计算。Summary 类型的样本也会提供三种指标(假设指标名称为 ):
- 样本值的分位数分布情况,命名为
{quantile=“0.5”} 请求中有 50% 的请求响应时间值是 - 所有样本值的大小总和,命名为
_sum 所有请求响应时间总和 - 样本总数,命名为
_count 请求的总数
Histogram 与 Summary 的异同:
它们都包含了
Histogram 需要通过
go sdk实战
准备工作
- 在Prometheus配置文件中添加新的job配置本机地址
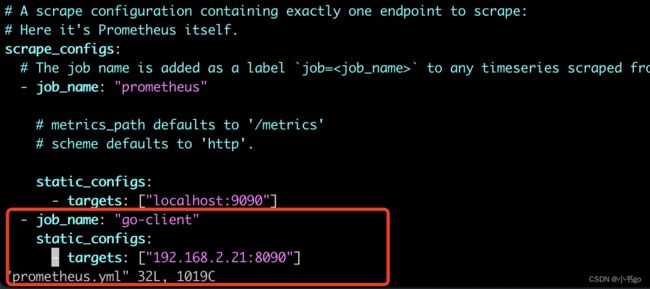
- 重启Prometheus
- 查看是否job监控成功
- 实际是从web服务的这个path中获取监控指标信息

案例1 Counter 统计班级人数,每个人有name和age两个属性(label)
main.go
package main

import (
	"net/http"

	qzPro "gitee.com/qzcsu/go-web-study/service/prometheus"
	"github.com/prometheus/client_golang/prometheus"
	"github.com/prometheus/client_golang/prometheus/promhttp"
)

func main() {
	prometheus.MustRegister(qzPro.CommonCounter, qzPro.FuncCounter, qzPro.VecCounter)
	http.HandleFunc("/common_counter", qzPro.DealCommCounter)
	http.HandleFunc("/vec_counter", qzPro.DealVecCounter)
	http.Handle("/metrics", promhttp.Handler())
	http.ListenAndServe(":8090", nil)
}
service/prometheus/constants.go
// service/prometheus/constants.go
package prometheus

import (
	"fmt"
	"net/http"
	"strconv"

	"gitee.com/qzcsu/go-web-study/utils/randomutil"
)

const (
	namePrefix = "the_number_of_student"
	subSys     = "client_golang"
	nameSpace  = "prometheus_demo"
)

var names = []string{"小明", "小红", "小花"}
var ages = []int64{20, 21, 22, 23, 24, 25}

func GetParamNum(req *http.Request) int64 {
	err := req.ParseForm()
	if err != nil {
		fmt.Println("parse form err")
		return 0
	}
	numStr := req.Form.Get("num")
	fmt.Printf("numStr:[%v]\n", numStr)
	num, err := strconv.ParseInt(numStr, 10, 64)
	if err != nil {
		fmt.Printf("parse int err :%v\n", err)
		return 0
	}
	return num
}

// randData随机获取一个元素,并且将本次请求的随机元素统计到countStrMap
func getCurRandomStrMap(countStrMap map[string]int64, randData []string) string {
	index := randomutil.RandomNum(0, int64(len(randData)))
	randVal := randData[index]
	countStrMap[randVal] = countStrMap[randVal] + 1
	return randVal
}

// randData随机获取一个元素,并且将本次请求的随机元素统计到countIntMap
func getCurRandomIntMap(countIntMap map[int64]int64, randData []int64) string {
	index := randomutil.RandomNum(0, int64(len(randData)))
	randVal := randData[index]
	countIntMap[randVal] = countIntMap[randVal] + 1
	return fmt.Sprintf("%d", randVal)
}
service/prometheus/couter.go
// service/prometheus/couter.go
package prometheus

import (
	"fmt"
	"net/http"
	"sync/atomic"
	"time"

	"github.com/prometheus/client_golang/prometheus"

	"gitee.com/qzcsu/go-web-study/utils/randomutil"
)

const counterNamePrefix = namePrefix + "_counter"

// CommonCounter 普通的计数器
var commonCounterTotalCount int64
var CommonCounter = prometheus.NewCounter(
	prometheus.CounterOpts{
		Subsystem: subSys,
		Namespace: nameSpace,
		Help:      "desc the metric",
		Name:      fmt.Sprintf("%s:%s", counterNamePrefix, "common"),
		//ConstLabels: map[string]string{"name":"555"}, // 每个打点必定会带这个label
	},
)

// 有自己的计算函数的计数器,但是要保证递增,只有在客户端来拉去这个指标的时候才会触发这个函数计算获取最新的指标值
var funcCounterTotalCount int64
var FuncCounter = prometheus.NewCounterFunc(prometheus.CounterOpts{
	Subsystem: subSys,
	Namespace: nameSpace,
	Name:      fmt.Sprintf("%s:%s", counterNamePrefix, "func"),
}, func() float64 {
	delta := randomutil.RandomNum(0, 3) // 模拟随机增长步长 0|1|2
	newNum := atomic.AddInt64(&funcCounterTotalCount, delta)
	return float64(newNum)
})

// VecCounter 带有 "name", "age" 标签的计数器
var vecCounterTotalCount int64
var VecCounter = prometheus.NewCounterVec(
	prometheus.CounterOpts{
		Subsystem: subSys,
		Namespace: nameSpace,
		Name:      fmt.Sprintf("%s:%s", counterNamePrefix, "vec"),
	}, []string{"name", "age"})

func DealCommCounter(w http.ResponseWriter, req *http.Request) {
	dealCount := GetParamNum(req)
	var curDealCount int64
	go func() {
		ticker := time.NewTicker(3 * time.Second)
		for {
			<-ticker.C
			CommonCounter.Inc()
			curDealCount++
			atomic.AddInt64(&commonCounterTotalCount, 1)
			fmt.Printf("commonCounterTotalCount:%v,curDealCount:%v\n", commonCounterTotalCount, curDealCount)
			if curDealCount == dealCount {
				fmt.Println("DealCounter结束")
				return
			}
		}
	}()
	fmt.Fprintf(w, "DealCommCounter done !!!")
}

func DealVecCounter(w http.ResponseWriter, req *http.Request) {
	dealCount := GetParamNum(req)
	var curDealCount int64
	go func() {
		ticker := time.NewTicker(3 * time.Second)
		thisNameMap := make(map[string]int64)
		thisAgeMap := make(map[int64]int64)
		for {
			<-ticker.C
			nameStr := getCurRandomStrMap(thisNameMap, names)
			ageStr := getCurRandomIntMap(thisAgeMap, ages)
			VecCounter.With(prometheus.Labels{"name": nameStr, "age": ageStr}).Inc()
			curDealCount++
			atomic.AddInt64(&vecCounterTotalCount, 1)
			fmt.Printf("vecCounterTotalCount:%v,curDealCount:%v, nameMap:%v, ageMap:%v\n", vecCounterTotalCount, curDealCount, thisNameMap, thisAgeMap)
			if curDealCount == dealCount {
				fmt.Println("DealVecCounter结束")
				return
			}
		}
	}()
	fmt.Fprintf(w, "DealVecCounter done !!!")
}
测试
- http请求访问触发打点统计,由请求参数num决定本次请求要增加的打点总数,每次打点会睡眠3s
- vec_counter每次请求都会带上label,label的name和age取值来源于以下两个数组的随机取值,定义在constant.go中
- var names = []string{“小明”, “小红”, “小花”}
- var ages = []int64{20, 21, 22, 23, 24, 25}
- http://localhost:8090/vec_counter?num=10 带tag的打点
- http://localhost:8090/common_counter?num=10
- http://localhost:8090/metrics 可查看对应指标现在的打点次数
- metric的命名为 namespace_subsystem_name 本次测试的 nameSpace=prometheus_demo,subsystem=client_golang,name=the_number_of_people_couter:[common|func|vec]
分别访问http://localhost:8090/vec_counter?num=10 和 http://localhost:8090/common_counter?num=10 一次 然后浏览器查看指标 http://localhost:8090/metrics 查看指标
prometheus_demo_client_golang_the_number_of_people_counter:func 值为4的原因是每次来查询一下metrics 则会触发一下查询函数,mock的函数中每次访问可能增加0,1,2的步长
案例2 Gague 模拟班级人员流动情况,每个人都有name,age属性
main.go
package main

import (
	"net/http"

	qzPro "gitee.com/qzcsu/go-web-study/service/prometheus"
	"github.com/prometheus/client_golang/prometheus"
	"github.com/prometheus/client_golang/prometheus/promhttp"
)

func main() {
	prometheus.MustRegister(qzPro.CommonCounter, qzPro.FuncCounter, qzPro.VecCounter, qzPro.CommonGauge, qzPro.FuncGauge, qzPro.VecGauge)
	http.HandleFunc("/common_counter", qzPro.DealCommCounter)
	http.HandleFunc("/vec_counter", qzPro.DealVecCounter)
	http.HandleFunc("/common_gauge", qzPro.DealCommGauge)
	http.HandleFunc("/vec_gauge", qzPro.DealVecGauge)
	http.Handle("/metrics", promhttp.Handler())
	http.ListenAndServe(":8090", nil)
}
service/prometheus/constants.go
见上
service/prometheus/gague.go
package prometheus

import (
	"fmt"
	"net/http"
	"sync/atomic"
	"time"

	"github.com/prometheus/client_golang/prometheus"

	"gitee.com/qzcsu/go-web-study/utils/randomutil"
)

const GaugeNamePrefix = namePrefix + "_gauge"

// CommonGauge 普通的仪表盘
var commonGaugeTotalCount int64
var CommonGauge = prometheus.NewGauge(
	prometheus.GaugeOpts{
		Subsystem: subSys,
		Namespace: nameSpace,
		Help:      "desc the metric",
		Name:      fmt.Sprintf("%s:%s", GaugeNamePrefix, "common"),
	},
)

// 有自己的计算函数的仪表盘,只有在客户端来拉去这个指标的时候才会触发这个函数计算获取最新的指标值
var funcGaugeTotalCount int64
var FuncGauge = prometheus.NewGaugeFunc(prometheus.GaugeOpts{
	Subsystem: subSys,
	Namespace: nameSpace,
	Name:      fmt.Sprintf("%s:%s", GaugeNamePrefix, "func"),
}, func() float64 {
	deltaVal := randomutil.RandomNum(0, 5) // 模拟变动步长
	idx := randomutil.RandomNum(0, 3)      // 模拟增加还是减少 0减少,1和2增加,整体保持一个增长趋势图会好看点
	var newNum int64
	if idx == 0 {
		newNum = atomic.AddInt64(&funcGaugeTotalCount, -deltaVal)
	} else {
		newNum = atomic.AddInt64(&funcGaugeTotalCount, deltaVal)
	}
	return float64(newNum)
})

// VecGauge 带有 "name", "age" 标签的仪表盘
var vecGaugeTotalCount int64
var VecGauge = prometheus.NewGaugeVec(
	prometheus.GaugeOpts{
		Subsystem: subSys,
		Namespace: nameSpace,
		Name:      fmt.Sprintf("%s:%s", GaugeNamePrefix, "vec"),
	}, []string{"name", "age"})

func DealCommGauge(w http.ResponseWriter, req *http.Request) {
	dealCount := GetParamNum(req)
	var curDealCount int64
	go func() {
		ticker := time.NewTicker(3 * time.Second)
		for {
			<-ticker.C
			idx := randomutil.RandomNum(0, 3)      // 模拟变动步长
			deltaVal := randomutil.RandomNum(0, 5) // 模拟增加还是减少 0减少,1和2增加
			if idx == 0 {
				CommonGauge.Sub(float64(deltaVal))
				atomic.AddInt64(&commonCounterTotalCount, -deltaVal)
			} else {
				CommonGauge.Add(float64(deltaVal))
				atomic.AddInt64(&commonCounterTotalCount, deltaVal)
			}
			curDealCount++
			atomic.AddInt64(&commonGaugeTotalCount, 1)
			fmt.Printf("commonGaugeTotalCount:%v,curDealCount:%v\n", commonGaugeTotalCount, curDealCount)
			if curDealCount == dealCount {
				fmt.Println("DealCounter结束")
				return
			}
		}
	}()
	fmt.Fprintf(w, "DealCommGauge done !!!")
}

func DealVecGauge(w http.ResponseWriter, req *http.Request) {
	dealCount := GetParamNum(req)
	var curDealCount int64
	go func() {
		ticker := time.NewTicker(3 * time.Second)
		thisNameMap := make(map[string]int64)
		thisAgeMap := make(map[int64]int64)
		for {
			<-ticker.C
			idx := randomutil.RandomNum(0, 3)
			deltaVal := randomutil.RandomNum(0, 5)
			nameStr := getCurRandomStrMap(thisNameMap, names)
			ageStr := getCurRandomIntMap(thisAgeMap, ages)
			if idx == 0 {
				VecGauge.With(prometheus.Labels{"name": nameStr, "age": ageStr}).Sub(float64(deltaVal))
				atomic.AddInt64(&vecGaugeTotalCount, -deltaVal)
			} else {
				VecGauge.With(prometheus.Labels{"name": nameStr, "age": ageStr}).Add(float64(deltaVal))
				atomic.AddInt64(&vecGaugeTotalCount, deltaVal)
			}
			curDealCount++
			atomic.AddInt64(&vecGaugeTotalCount, 1)
			fmt.Printf("vecGaugeTotalCount:%v,curDealCount:%v, nameMap:%v, ageMap:%v\n", vecGaugeTotalCount, curDealCount, thisNameMap, thisAgeMap)
			if curDealCount == dealCount {
				fmt.Println("DealVecCounter结束")
				return
			}
		}
	}()
	fmt.Fprintf(w, "DealVecGauge done !!!")
}
测试
- 同Counter一样,gague每次打点处理都是定时器3秒一次
- 同样测试的是三个函数 gague、gagueFunc、gagueVec
- gague由于是可增加可减少,因此用了随机函 idx := randomutil.RandomNum(0, 3) 生成 0,1,2来模拟增减,0为减,1,2为增加,因此大概率上是为正累加。使用另外一个函数模拟变动步长deltaVal := randomutil.RandomNum(0, 5)。
- 三个metric
- prometheus_demo_client_golang_the_number_of_people_gauge:common
- prometheus_demo_client_golang_the_number_of_people_gauge:func
- prometheus_demo_client_golang_the_number_of_people_gauge:vec
- 先访问 http://localhost:8090/vec_gauge?num=10
- 在访问 http://localhost:8090/common_gauge?num=10
- 最后验证 http://localhost:8090/metrics

grafana配置指标面板
grafana 安装
下载
wget https://dl.grafana.com/enterprise/release/grafana-enterprise-8.5.1.linux-amd64.tar.gz
解压
tar -zxvf grafana-enterprise-8.5.1.linux-amd64.tar.gz
当前目录结构

启动
/home/ubuntu/soft/grafana-8.5.1/bin/grafana-server
访问
http://192.168.64.2:3000/ 初始密码和用户名都是 admin,首次登录后会强制要求修改初始密码。
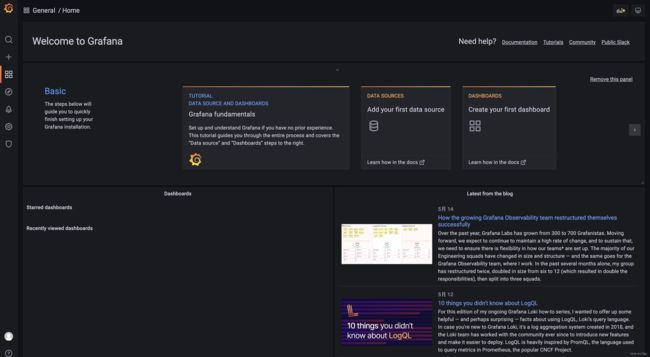
登录进来的初始面板
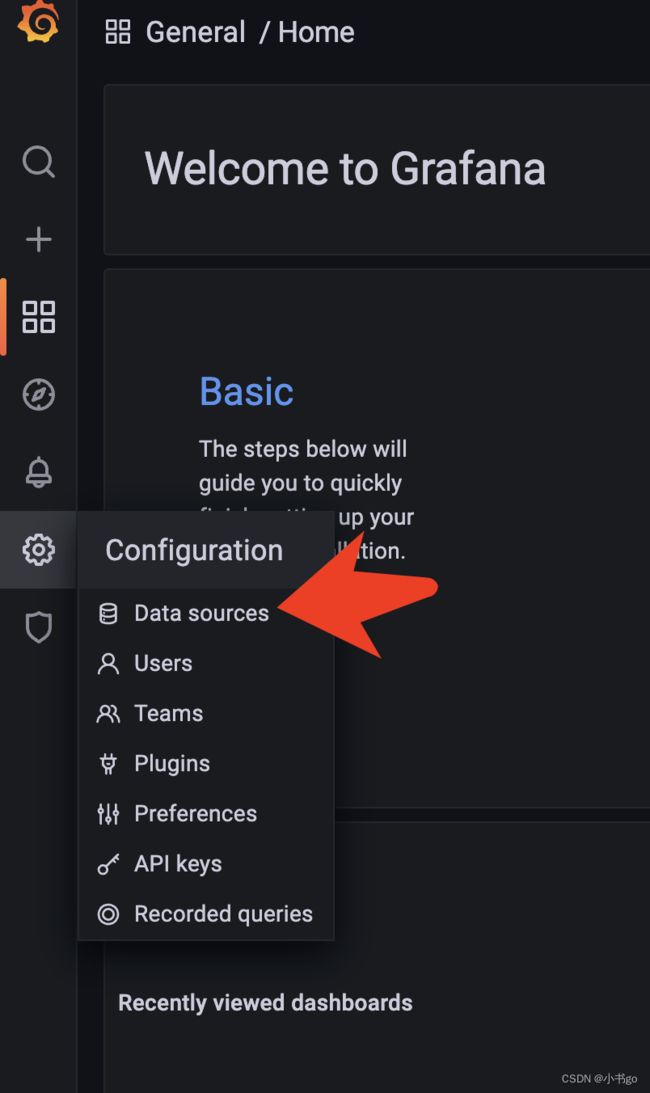
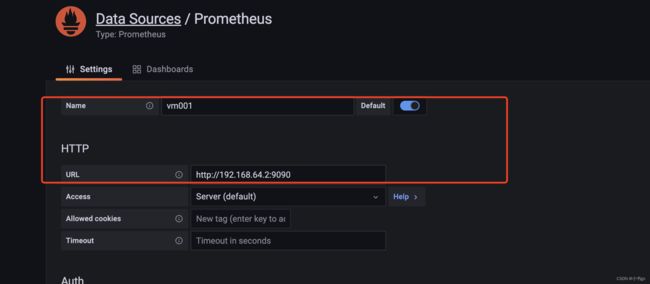
添加metric数据源,grafana支持很多种数据源图形的配置,这里我们选择Prometheus
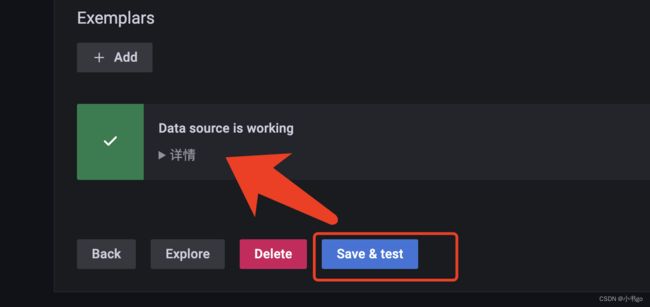
只需配置这两项就行了

指标配置
创建dashboard
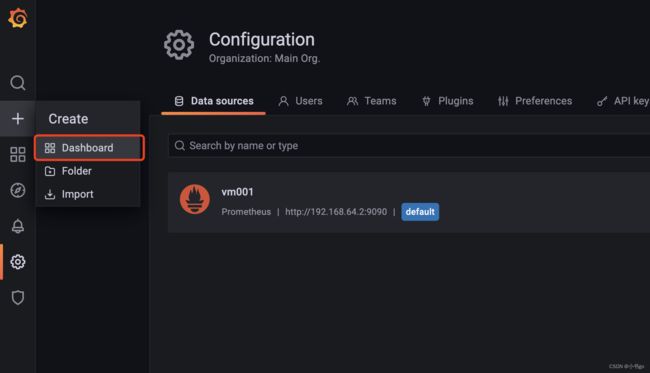
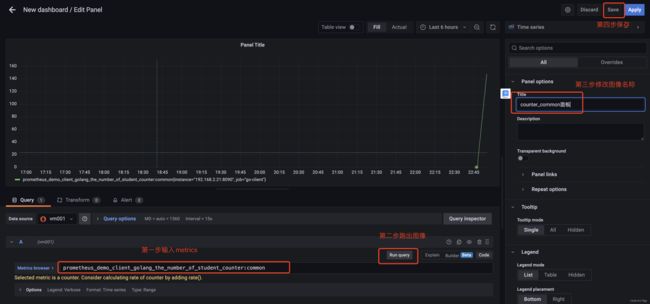
创建面板

Counter和Gague common和func指标配置方式
dashboard上的基本操作

Counter和Gague vec指标配置方式
按照name分组
在当前的dashboard上增加新的面板,新增两个query


同样按照age配置分组

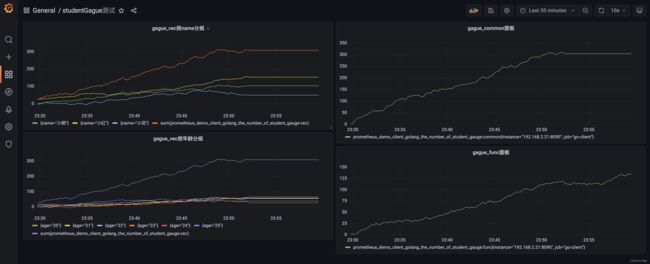
图形样例
counter common与vec访问500次图像
http://localhost:8090/common_counter?num=500
http://localhost:8090/vec_counter?num=500

gague common与vec访问500次图像
http://localhost:8090/common_gague?num=500
http://localhost:8090/vec_gague?num=500
总结
遇到的问题
- Prometheus 机器时钟与实际上报的时间不符合。
- 原因:Prometheus server机器的时钟与本地的时钟不一致
- 解决:使用 sudo hwclock -s 将时钟对齐
展望
本文主播介绍了Prometheus的基本概念以及数据模型和指标,描述了安装使用过程,并使用go_client 的两个案例来说明 Counter和Gague的使用。并且结合Grafana配置出炫酷的图形。
接下来还会将 Histogram和Summary的案例进行补齐。并且结合Prometheus 实现一个配置告警功能实现自动告警机制