时间序列模型R语言实现-批量建模,预测(ARIMA, 随机森林)
时间序列预测首先要确定预测的内容。
- 本文预测共享单车的日租借量
- 使用的是每日数据
- 预测的时间范围是需要提前一个月、半年还是一年?根据预测范围,会使用到不同的模型。
- 首先安装加载本文所需要的包
install.packages("modeltime")
library(tidymodels)
library(modeltime)
library(timetk)
library(lubridate)
library(tidyverse)
library(forecast)
1.数据准备/处理
我们研究的数据集为共享自行车的租用量,我们将数据集简化为具有“日期”和“值”列的单变量时间序列。
df_bike = bike_sharing_daily %>%
  select(dteday, cnt) %>%
  set_names(c("date", "value"))

glimpse(df_bike)
## Rows: 731
## Columns: 2
## $ date   2011-01-01, 2011-01-02, 2011-01-03, 2011-01-04, 2011-01-05, 201…
## $ value  985, 801, 1349, 1562, 1600, 1606, 1510, 959, 822, 1321, 1263, 11…
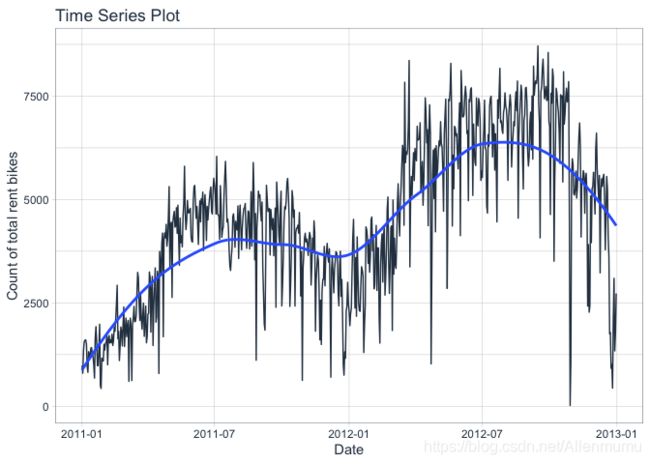
接下来,使用 plot_time_series() 函数可视化数据集。调参 .interactive = TRUE 以获得可交互的绘图,若为FALSE 返回 ggplot2 静态图,默认为TRUE。
df_bike %>%
  plot_time_series(date, value, .interactive = F) +
  xlab("Date") +
  ylab("Count of total rent bikes")
数据的时间跨度为2011-01-11至2013-01-01,共计731个数据,从图中可以看出数据量较大,不易于分析,为更好地观察趋势,应该将数据再划分为更小的时间跨度,具体根据结果确定。可以看出,这张图没有特别明显的趋势,是否有很强的季节性(每周/每月)?
- 接着检测数据是否具有季节性
df_bike %>%
  plot_seasonal_diagnostics(date, value, .interactive = FALSE)
可以看到共享单车租用量具有月度季节性,在第2、3季度租用量大于第1、4季度。这很可能是因为第1、4季度是冬天。
2.训练/测试
使用函数time_series_split() 去创建训练集和测试集
- 设置 assess = "3 months 表明后3个月为测试集
- 设置 cumulative = TRUE 表明采样使用所有前面的先验数据作为训练集。
splits = df_bike %>%
  time_series_split(assess = "3 months", cumulative = T)
## Using date_var: date
接下来可视化训练/测试集
- tk_time_series_cv_plan(): 将拆分的对象转化为数据框
- plot_time_series_cv_plan(): 使用数据里的"date"和"value"列画图
splits %>%
  tk_time_series_cv_plan() %>%
  plot_time_series_cv_plan(date, value, .interactive = F)
3. 建模
处理并观察为数据之后,现在就可以建模了。 我们主要用modeltime和parsnip函数建模。
3.1 Automatic Models
自动模型通常是已经自动化的建模方法。这包括来自forecast包的“Auto ARIMA”和“Auto ETS”功能以及来自prophet包的“Prophet”算法。这些算法已集成到modeltime包中中。设置过程很简单:
- 模型选择:使用规范函数(例如 arima_reg()、prophet_reg())来初始化算法和关键参数
- 引擎:使用可用于选择模型的引擎训练模型。
- 拟合模型:将模型拟合到训练数据
Auto ARIMA
接下来先拟合自动ARIMA模型:
- 模型选择: arima_reg() 这将设置您的通用模型算法和关键参数
- 设置训练引擎: set_engine(“auto_arima”) 选择要使用的特定包函数,可以在此处添加任何函数级参数。
- 拟合模型:fit(value ~ date, training(splits)) <– 所有模型时间模型都需要一个日期列作为回归量。
model_arima = arima_reg() %>%
  set_engine("auto_arima") %>%
  fit(value ~ date, training(splits))
## frequency = 7 observations per 1 week
model_arima
## parsnip model object
##
## Fit time:  382ms
## Series: outcome
## ARIMA(0,1,3) with drift
##
## Coefficients:
##           ma1      ma2      ma3   drift
##       -0.6106  -0.1868  -0.0673  9.3169
## s.e.   0.0396   0.0466   0.0398  4.6225
##
## sigma^2 estimated as 730568:  log likelihood=-5227.22
## AIC=10464.44   AICc=10464.53   BIC=10486.74
Prophet
类似于 Auto Arima模型,同理我们训练 Prophet模型如下:
model_prophet = prophet_reg(seasonality_yearly = TRUE) %>%
  set_engine("prophet") %>%
  fit(value ~ date, training(splits))
model_prophet
3.2机器学习模型
首先,我将使用 **recipe()**函数 创建一个预处理配方并添加时间序列步骤。该过程使用“日期”列来创建我想要建模的 45 个新特征。其中包括时间序列特征和傅立叶级数。
recipe_spec = recipe(value ~ date, training(splits)) %>%
  step_timeseries_signature(date) %>%
  step_rm(contains("am.pm"), contains("hour"), contains("minute"),
          contains("second"), contains("xts")) %>%
  step_fourier(date, period = 365, K =5) %>%
  step_dummy(all_nominal())

recipe_spec %>% prep() %>% juice()
Elastic Net
训练 Elastic NET 模型很容易。只需使用 linear_reg() 和 set_engine(“glmnet”) 设置模型。请注意,我们还没有拟合模型(正如我们在前面的步骤中所做的那样)。
model_spec_glmnet <- linear_reg(penalty = 0.01, mixture = 0.5) %>%
  set_engine("glmnet")
接下来,制作一个适合的工作流程:
- 添加模型设定:add_model(model_spec_glmnet)
- 添加预处理:add_recipe(recipe_spec %>% step_rm(date)) <– 请注意,我正在删除“日期”列,因为机器学习算法通常不知道如何处理日期或日期时间特征
- 拟合工作流程: fit(training(splits))
workflow_fit_glmnet <- workflow() %>%
  add_model(model_spec_glmnet) %>%
  add_recipe(recipe_spec %>% step_rm(date)) %>%
  fit(training(splits))
随机森林模型
同理类似于 Elastic Net模型
model_spec_rf <- rand_forest(trees = 500, min_n = 50) %>%
  set_engine("randomForest")

workflow_fit_rf <- workflow() %>%
  add_model(model_spec_rf) %>%
  add_recipe(recipe_spec %>% step_rm(date)) %>%
  fit(training(splits))
3.3Hybrid ML Models
我已经包含了几个混合模型(例如 arima_boost() 和 prophet_boost()),它们将两种自动化算法与机器学习相结合。接下来我将展示prophet_boost()!
Prophet Boost
Prophet Boost 算法将 Prophet 与 XGBoost 相结合,以实现两全其美(即 Prophet 自动化 + 机器学习)。该算法的工作原理是:
- 首先使用 Prophet 对单变量序列进行建模
- 使用通过预处理配方提供的回归器(记住我们的配方生成了 45 个新特征),并使用 XGBoost 模型回归 Prophet Residuals
我们可以像使用机器学习算法一样使用工作流来设置模型。
model_spec_prophet_boost <- prophet_boost(seasonality_yearly = TRUE) %>%
  set_engine("prophet_xgboost")

workflow_fit_prophet_boost <- workflow() %>%
  add_model(model_spec_prophet_boost) %>%
  add_recipe(recipe_spec) %>%
  fit(training(splits))
4. Modeltime 工作流
通过modeltime包加速模型评估和模型选择
modeltime 工作流旨在加快模型评估和选择。现在我们有几个时间序列模型,让我们分析它们并使用 modeltime 工作流来进行预测。
4.1 Modeltime Table
Modeltime Table 用 ID 组织模型并创建通用描述以帮助我们跟踪我们的模型。让我们将模型添加到 modeltime_table() 中。
model_table <- modeltime_table(
  model_arima,
  model_prophet,
  workflow_fit_glmnet,
  workflow_fit_rf,
  workflow_fit_prophet_boost
)

model_table
4.2 校准 Calibration
模型校准用于量化误差和估计置信区间。我们将使用 modeltime_calibrate() 函数对样本外数据(又名测试集)执行模型校准。生成了两个新列(“.type”和“.calibration_data”),其中最重要的是“.calibration_data”。这包括测试集的实际值、拟合值和残差。
calibration_table = model_table %>%
  modeltime_calibrate(testing(splits))

calibration_table
4.3 预测(测试集)
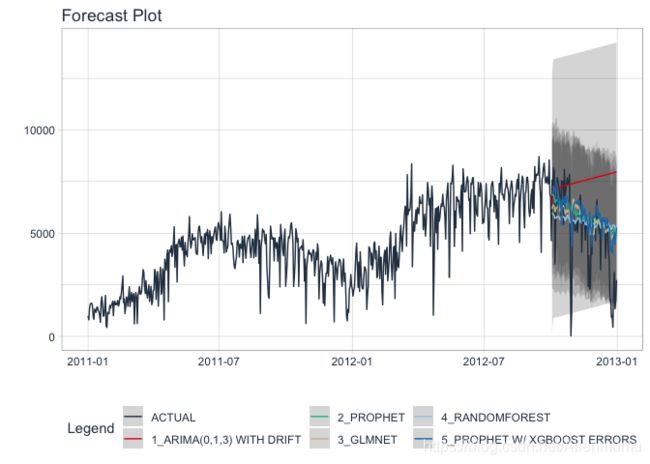
使用校准数据,我们可以可视化测试预测(预测)。
- 使用 modeltime_forecast() 将测试集的预测数据生成为tibble数据框格式。
- 使用 plot_modeltime_forecast() 以交互式和静态绘图格式可视化结果。
calibration_table %>%
  modeltime_forecast(actual_data = df_bike) %>%
  plot_modeltime_forecast(.interactive = FALSE)
## Using '.calibration_data' to forecast.
## Warning in max(ids, na.rm = TRUE): no non-missing arguments to max; returning -
## Inf
4.4 准头率(测试集)
接下来,计算测试精度以比较模型。
- 使用 modeltime_accuracy() 生成样本外准确度指标生成为tibble数据框格式。
- 使用 table_modeltime_accuracy() 生成交互式和静态表格
calibration_table %>%
  modeltime_accuracy() %>%
  table_modeltime_accuracy(.interactive = FALSE)
4.5 分析结果
从准确度度量和预测结果中,我们看到:
- Auto ARIMA 模型不太适合此数据。
- 最好的模型是 Prophet + XGBoost
我们从最终模型中排除 Auto ARIMA,然后使用其余模型进行未来的预测。
5.重新拟合向前预测
- modeltime_refit(): 我们重新训练完整的数据集(df_bike)
- modeltime_forecast(): 对于只依赖“日期”特征的模型,可以使用h(horizon)来进行向前预测。设置h = “12个月” 预测模型接下来12个月的数据。
calibration_table %>%
  # Remove ARIMA model with low accuracy
  filter(.model_id != 1) %>%

  # Refit and Forecast Forward
  modeltime_refit(df_bike) %>%
  modeltime_forecast(h = "12 months", actual_data = df_bike) %>%
  plot_modeltime_forecast(.interactive = FALSE)
6.如何让模型拟合的更好?
本文只是触及了表面,modeltime 包的功能比这里介绍的要丰富得多,以下是没有涵盖的内容:
-
特征工程:时间序列分析的艺术是特征工程。 Modeltime 与尖端的时间序列预处理工具配合使用,包括recipes和 timetk 包中的工具。
-
超参数调整:可以调整 ARIMA 模型和机器学习模型。有对与错的方式(两种类型都不一样)。
-
可扩展性:训练多个时间序列组和自动化是组织中一个巨大的需求领域。您需要知道如何将分析扩展到数千个时间序列。
-
优势和劣势:您是否知道某些机器学习模型更适合趋势、季节性,但不是两者兼而有之?为什么 ARIMA 对于某些数据集更好?随机森林和 XGBoost 什么时候会失败?
-
深度学习:循环神经网络 (RRN) 一直在压制时间序列竞赛。它们会用于业务数据吗?你如何实施它们?


