当当~Python采集商品数据信息并作可视化效果
前言
嗨喽~大家好呀,这里是魔王呐 ❤ ~!

python资料、源码、教程: 点击此处跳转文末名片获取
环境使用:
首先我们先来安装一下写代码的软件(对没安装的小白说)
-
版 本: python 3.8
-
编辑器: pycharm 2022.3.2 专业版
模块使用:
-
requests >>> pip install requests 数据请求
-
parsel >>> pip install parsel 数据解析
-
csv <表格文件> 内置模块 保存数据
模块安装:
win + R 输入cmd 输入安装命令 pip install 模块名
(如果你觉得安装速度比较慢, 你可以切换国内镜像源)
代码步骤:
-
发送请求
-
获取数据
-
解析数据
-
保存数据
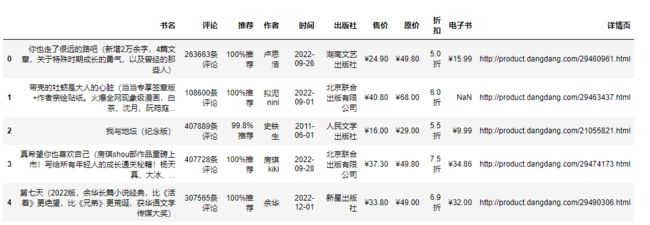
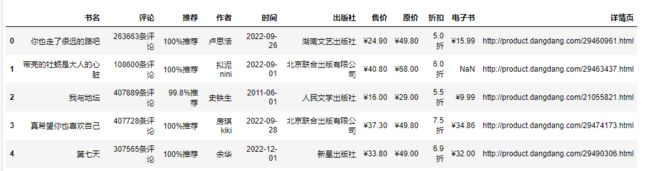
采集代码展示:
# 导入数据请求模块 --> 第三方模块, 需要安装 pip install requests
import requests
# 导入数据解析模块 --> 第三方模块, 需要安装 pip install parsel
import parsel
# 导入csv模块
import csv
"""
1. 发送请求 --> 模拟浏览器对url请求发送请求
 -  响应对象
    200 状态码 --> 表示请求成功

多页数据采集:
分析请求链接变化规律

 """
for page in range(1, 26):
请求链接
url = f'http://****m/books/bestsellers/01.00.00.00.00.00-recent30-0-0-1-{page}'
伪装 模拟 --> 请求头 字典数据类型
    headers = {
        # User-Agent 用户代理 表示浏览器基本身份信息
        'User-Agent': 'Mozilla/5.0 (Windows NT 10.0; WOW64) AppleWebKit/537.36 (KHTML, like Gecko) Chrome/101.0.0.0 Safari/537.36'
    }
发送请求 等号左边都是自定义变量名
response = requests.get(url=url, headers=headers)
"""
2. 获取数据, 获取网页源代码
    response.text 获取响应对象文本数据
变量名 --> 见名知意

3. 解析数据, 提取我们想要的内容
    css选择器:
"""
selector = parsel.Selector(response.text)
第一次提取 获取所有书籍所对应li标签
lis = selector.css('.bang_list_mode li')
for循环遍历
for li in lis:
“”"
提取具体数据信息
css选择器 --> 可以直接复制粘贴就好了
get 获取第一个标签数据内容
“”"
        title = li.css('.name a::attr(title)').get()  # 书名
        star = li.css('.star a::text').get()  # 评论
        recommend = li.css('.tuijian::text').get()  # 推荐
        writer = li.css('.publisher_info a::text').get()  # 作者
        date = li.css('.publisher_info span::text').get()  # 时间
        publisher = li.css('div:nth-child(6) a::text').get()  # 出版社
        price_n = li.css('.price .price_n::text').get()  # 售价
        price_r = li.css('.price .price_r::text').get()  # 原价
        price_s = li.css('.price .price_s::text').get()  # 折扣
        price_e = li.css('.price_e .price_n::text').get()  # 电子书
        href = li.css('.name a::attr(href)').get()  # 详情页
创建字典
        dit = {
            '书名': title,
            '评论': star,
            '推荐': recommend,
            '作者': writer,
            '时间': date,
            '出版社': publisher,
            '售价': price_n,
            '原价': price_r,
            '折扣': price_s,
            '电子书': price_e,
            '详情页': href,
        }
        csv_writer.writerow(dit)
        print(title, star, recommend, writer, date, publisher, price_n, price_r, price_s, price_e, href)
创建表格保存数据
f = open('书籍.csv', mode='a', encoding='utf-8', newline='')
csv_writer = csv.DictWriter(f, fieldnames=[
    '书名',
    '评论',
    '推荐',
    '作者',
    '时间',
    '出版社',
    '售价',
    '原价',
    '折扣',
    '电子书',
    '详情页',
])
写入表头
csv_writer.writeheader()
可视化代码展示:
1.导入模块
import pandas as pd
from pyecharts.charts import *
from pyecharts.globals import ThemeType#设定主题
from pyecharts.commons.utils import JsCode
import pyecharts.options as opts
2.导入数据
df = pd.read_csv('data.csv', encoding='utf-8', engine='python')
df.head()
3.数据处理
df['书名'] = df['书名'].apply(lambda x:x.split('(')[0])
df.head()
df['书籍简介'] = df['书名'].str.extract('.*?((.*?))')
df['书籍简介'].fillna('无', inplace=True)
df.head(1)

提取评论数
data = df.apply(lambda x:x['评论'].split('条评论')[0], axis=1)
df['评论数'] = data.astype('int64')
df.head(1)

原价、售价、电子书价格 数值化
df['原价'] = df['原价'].str.replace('¥', '')
df['售价'] = df['售价'].str.replace('¥', '')
df['电子书价格'] = df['电子书'].str.replace('¥', '')
df.head(1)

df.info()
df['原价'] = df['原价'].str.replace(',', '').astype('float64')
df['售价'] = df['售价'].str.replace(',', '').astype('float64')
缺失值

电子书价格列额外处理


4.数据可视化
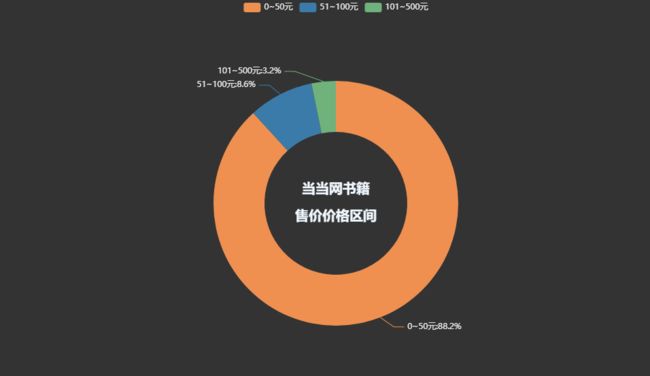
书籍总体价格区间
def tranform_price(x):
    if x <= 50.0:
        return '0~50元'
    elif x <= 100.0:
        return '51~100元'
    elif x <= 500.0:
        return '101~500元'
    elif x <= 1000.0:
        return '501~1000元'
    else:
        return '1000以上'
df['价格分级'] = df['原价'].apply(lambda x:tranform_price(x))
price_1 = df['价格分级'].value_counts()
datas_pair_1 = [(i, int(j)) for i, j in zip(price_1.index, price_1.values)]
df['售价价格分级'] = df['售价'].apply(lambda x:tranform_price(x))
price_2 = df['售价价格分级'].value_counts()
datas_pair_2 = [(i, int(j)) for i, j in zip(price_2.index, price_2.values)]
pie1 = (
    Pie(init_opts=opts.InitOpts(theme='dark',width='1000px',height='600px'))

    .add('', datas_pair_1, radius=['35%', '60%'])
    .set_series_opts(label_opts=opts.LabelOpts(formatter="{b}:{d}%"))
    .set_global_opts(
        title_opts=opts.TitleOpts(
            title="书籍\n\n原价价格区间",
            pos_left='center',
            pos_top='center',
            title_textstyle_opts=opts.TextStyleOpts(
                color='#F0F8FF',
                font_size=20,
                font_weight='bold'
            ),
        )
    )
    .set_colors(['#EF9050', '#3B7BA9', '#6FB27C', '#FFAF34', '#D8BFD8', '#00BFFF', '#7FFFAA'])
)
pie1.render_notebook()

pie1 = (
    Pie(init_opts=opts.InitOpts(theme='dark',width='1000px',height='600px'))

    .add('', datas_pair_2, radius=['35%', '60%'])
    .set_series_opts(label_opts=opts.LabelOpts(formatter="{b}:{d}%"))
    .set_global_opts(
        title_opts=opts.TitleOpts(
            title="书籍\n\n售价价格区间",
            pos_left='center',
            pos_top='center',
            title_textstyle_opts=opts.TextStyleOpts(
                color='#F0F8FF',
                font_size=20,
                font_weight='bold'
            ),
        )
    )
    .set_colors(['#EF9050', '#3B7BA9', '#6FB27C', '#FFAF34', '#D8BFD8', '#00BFFF', '#7FFFAA'])
)
pie1.render_notebook()
各个出版社书籍数量柱状图
counts = df.groupby('出版社')['书名'].count().sort_values(ascending=False).head(20)
bar=(
    Bar(init_opts=opts.InitOpts(height='500px',width='1000px',theme='dark'))
    .add_xaxis(counts.index.tolist())
    .add_yaxis(
        '出版社书籍数量',
        counts.values.tolist(),
        label_opts=opts.LabelOpts(is_show=True,position='top'),
        itemstyle_opts=opts.ItemStyleOpts(
            color=JsCode("""new echarts.graphic.LinearGradient(
            0, 0, 0, 1,[{offset: 0,color: 'rgb(255,99,71)'}, {offset: 1,color: 'rgb(32,178,170)'}])
            """
            )
        )
    )
    .set_global_opts(
        title_opts=opts.TitleOpts(
            title='各个出版社书籍数量柱状图'),
            xaxis_opts=opts.AxisOpts(name='书籍名称',
            type_='category',
            axislabel_opts=opts.LabelOpts(rotate=90),
        ),
        yaxis_opts=opts.AxisOpts(
            name='数量',
            min_=0,
            max_=29.0,
            splitline_opts=opts.SplitLineOpts(is_show=True,linestyle_opts=opts.LineStyleOpts(type_='dash'))
        ),
        tooltip_opts=opts.TooltipOpts(trigger='axis',axis_pointer_type='cross')
    )

    .set_series_opts(
        markline_opts=opts.MarkLineOpts(
            data=[
                opts.MarkLineItem(type_='average',name='均值'),
                opts.MarkLineItem(type_='max',name='最大值'),
                opts.MarkLineItem(type_='min',name='最小值'),
            ]
        )
    )
)
bar.render_notebook()

电子书版本占比
per = df['电子书'].value_counts()['无电子书版本']/len(df)
c = (
    Liquid()
    .add("lq", [1-per], is_outline_show=False)
    .set_global_opts(title_opts=opts.TitleOpts(title="电子书版本占比"))
)
c.render_notebook()


bar=(
    Bar(init_opts=opts.InitOpts(height='500px',width='1000px',theme='dark'))
    .add_xaxis(price_top.index.tolist())
    .add_yaxis(
        '书籍单价',
        price_top.values.tolist(),
        label_opts=opts.LabelOpts(is_show=True,position='top'),
        itemstyle_opts=opts.ItemStyleOpts(
            color=JsCode("""new echarts.graphic.LinearGradient(
            0, 0, 0, 1,[{offset: 0,color: 'rgb(255,99,71)'}, {offset: 1,color: 'rgb(32,178,170)'}])
            """
            )
        )
    )
    .set_global_opts(
        title_opts=opts.TitleOpts(
            title='单价最高的书籍详细柱状图'),
            xaxis_opts=opts.AxisOpts(name='书籍名称',
            type_='category',
            axislabel_opts=opts.LabelOpts(rotate=90),
        ),
        yaxis_opts=opts.AxisOpts(
            name='单价/元',
            min_=0,
            max_=1080.0,
            splitline_opts=opts.SplitLineOpts(is_show=True,linestyle_opts=opts.LineStyleOpts(type_='dash'))
        ),
        tooltip_opts=opts.TooltipOpts(trigger='axis',axis_pointer_type='cross')
    )

    .set_series_opts(
        markline_opts=opts.MarkLineOpts(
            data=[
                opts.MarkLineItem(type_='average',name='均值'),
                opts.MarkLineItem(type_='max',name='最大值'),
                opts.MarkLineItem(type_='min',name='最小值'),
            ]
        )
    )
)
bar.render_notebook()


import pyecharts.options as opts
from pyecharts.charts import Pie

"""

目前无法实现的功能:

1、迷之颜色映射的问题
"""
content = df['出版社'].value_counts()
# x = content.index.tolist()[:10]
# y = content.values.tolist()[:10]

x_data = content.index.tolist()[:10]
y_data = content.values.tolist()[:10]
data_pair = [list(z) for z in zip(x_data, y_data)]
data_pair.sort(key=lambda x: x[1])

c = (
    Pie(init_opts=opts.InitOpts(width="1600px", height="800px", bg_color="#2c343c"))
    .add(
        series_name="访问来源",
        data_pair=data_pair,
        rosetype="radius",
        radius="55%",
        center=["50%", "50%"],
        label_opts=opts.LabelOpts(is_show=False, position="center"),
    )
    .set_global_opts(
        title_opts=opts.TitleOpts(
            title="前10出版社, 书籍占比",
            pos_left="center",
            pos_top="20",
            title_textstyle_opts=opts.TextStyleOpts(color="#fff"),
        ),
        legend_opts=opts.LegendOpts(is_show=False),
    )
    .set_series_opts(
        tooltip_opts=opts.TooltipOpts(
            trigger="item", formatter="{a}
{b}: {c} ({d}%)"
        ),
        label_opts=opts.LabelOpts(color="rgba(255, 255, 255, 0.3)"),
    )

)
c.render_notebook()

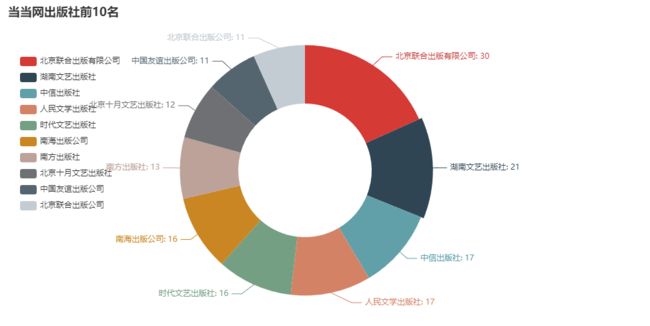
from pyecharts import options as opts
from pyecharts.charts import Pie
from pyecharts.faker import Faker
content = df['出版社'].value_counts()  # 读取出版社的数据
x_data = content.index.tolist()[:10]
y_data = content.values.tolist()[:10]
data_pair = [list(z) for z in zip(x_data, y_data)]
data_pair
# x_data = content.index.tolist()[:10]  #
# y_data = content.values.tolist()[:10]
# data_pair = [list(z) for z in zip(x_data, y_data)]
c = (
    Pie()
    .add(
        "",
        data_pair,
        radius=["40%", "75%"],
    )
    .set_global_opts(
        title_opts=opts.TitleOpts(title="出版社前10名"),
        legend_opts=opts.LegendOpts(orient="vertical", pos_top="15%", pos_left="2%"),
    )
    .set_series_opts(label_opts=opts.LabelOpts(formatter="{b}: {c}"))

)
c.render_notebook()
尾语
要成功,先发疯,下定决心往前冲!
学习是需要长期坚持的,一步一个脚印地走向未来!
未来的你一定会感谢今天学习的你。
—— 心灵鸡汤
本文章到这里就结束啦~感兴趣的小伙伴可以复制代码去试试哦