zabbix自定义监控
1.进程监控
在web客服端编写脚本 取出需要监控资源的状态值
//创建目录
[root@web ~]# mkdir /scripts

//编写内容脚本
[root@web ~]# vim /scripts/check_process.sh
[root@web ~]# cat /scripts/check_process.sh
#!/bin/bash
status=$(ps -ef |grep $1|grep -Ev "$0|grep"|wc -l)
if [ $status -eq 0 ];then
            echo '1'
    else
                echo '0'
        fi

//给执行权限
[root@web ~]# chmod +x /scripts/check_process.sh

//查看
[root@web ~]# ll /scripts/check_process.sh
-rwxr-xr-x 1 root root 129 Sep  7 01:04 /scripts/check_process.sh
[root@web ~]#
1.1在agent客服端编写配置文件
//将下面两行取消注释作修改,或者直接添加这两行
[root@localhost ~]# vim /usr/local/etc/zabbix_agentd.conf
# Mandatory: no
# Range: 0-1
# Default:
UnsafeUserParameters=1    //取消注释 改为1

### Option: UserParameter
#       User-defined parameter to monitor. There can be several user-defined parameters.
#       Format: UserParameter=,
#       See 'zabbix_agentd' directory for examples.
#
# Mandatory: no
# Default:
 UserParameter=check_process[*],/bin/bash /scripts/check_process.sh $1  //取消注释写入内容

//重启agent,生效作更改的配置
[root@web ~]# pkill zabbix_agentd
[root@web ~]# zabbix_agentd
[root@web ~]# ss -anlt
State     Recv-Q    Send-Q       Local Address:Port        Peer Address:Port   Process
LISTEN    0         128                0.0.0.0:22               0.0.0.0:*
LISTEN    0         128                0.0.0.0:10050            0.0.0.0:*
LISTEN    0         128                   [::]:22                  [::]:*
[root@web ~]#


//安装httpd服务
[root@web ~]# yum -y install httpd
[root@web ~]# systemctl start httpd
[root@web ~]# ss -anlt
State     Recv-Q    Send-Q       Local Address:Port        Peer Address:Port   Process
LISTEN    0         128                0.0.0.0:22               0.0.0.0:*
LISTEN    0         128                0.0.0.0:10050            0.0.0.0:*
LISTEN    0         128                   [::]:22                  [::]:*
LISTEN    0         128                      *:80                     *:*
[root@web ~]#

//在Server服务端端测试刚刚所做的进程监控配置
[root@localhost ~]# zabbix_get -s 192.168.141.135 -k check_process[httpd]
0
[root@localhost ~]# zabbix_get -s 192.168.141.135 -k check_process[mysql]
1
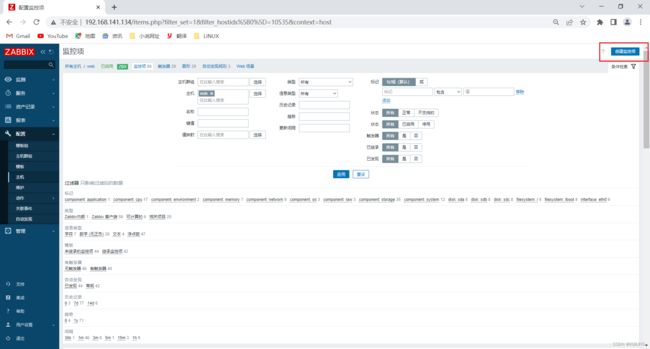
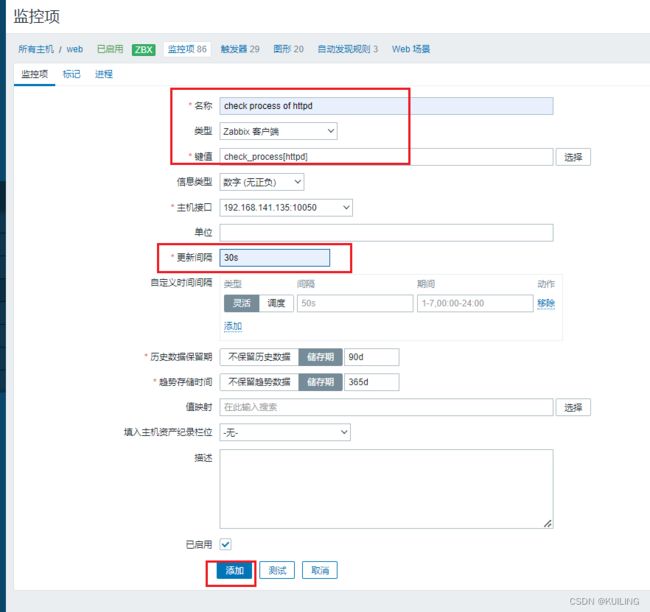
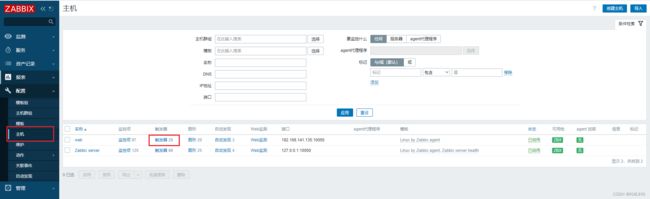
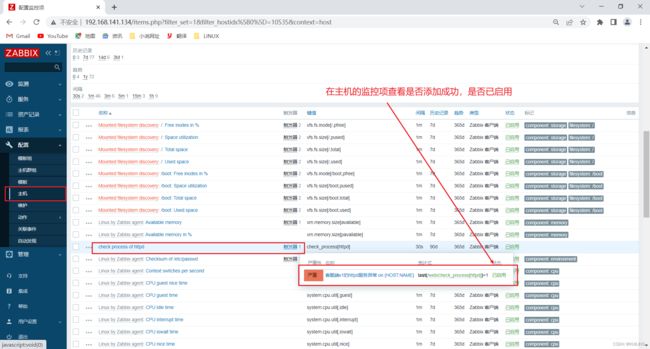
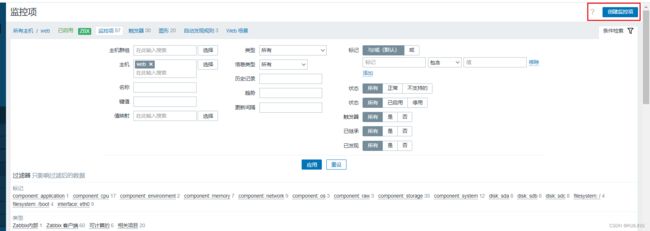
1.2在web界面添加监控项
在主机页面添加监控项

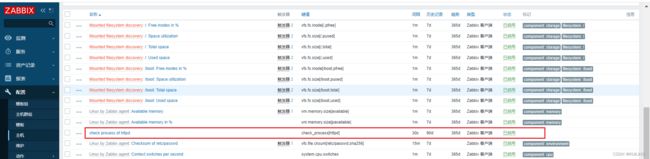
在监控项中查找是否创建成功
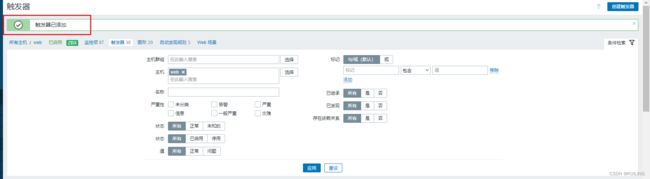
1.3在web界面添加触发器
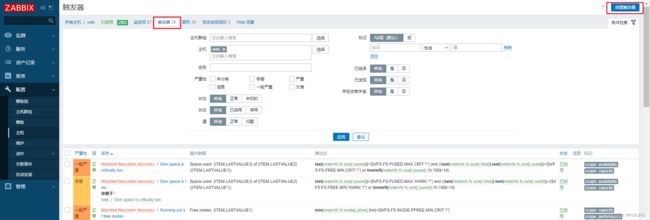

表达式添加方式

1.4手动触发警告
在web客服端中关闭httpd服务器
[root@web ~]# systemctl stop httpd
在个人邮箱查看是否收到问题报警信息

2.日志监控
2.1在web客服端编写脚本 取出需要监控资源的状态值
//下载python的编译器
[root@web ~]# yum -y install python38
[root@web ~]# yum -y install dos2unix
//写python脚本。因shell脚本只能在Linux系统执行,如zabbix需要监控Windows系统\
//则需要python脚本,py脚本在这两操作系统都能运行
[root@web ~]# vim /scripts/log.py
#!/usr/bin/env python3
import sys
import re

def prePos(seekfile):
    global curpos
    try:
        cf = open(seekfile)
    except IOError:
        curpos = 0
        return curpos
    except FileNotFoundError:
        curpos = 0
        return curpos
    else:
        try:
            curpos = int(cf.readline().strip())
        except ValueError:
            curpos = 0
            cf.close()
            return curpos
        cf.close()
    return curpos

def lastPos(filename):
    with open(filename) as lfile:
        if lfile.readline():
            lfile.seek(0,2)
        else:
            return 0
        lastPos = lfile.tell()
    return lastPos

def getSeekFile():
    try:
        seekfile = sys.argv[2]
    except IndexError:
        seekfile = '/tmp/logseek'
    return seekfile

def getKey():
    try:
        tagKey = str(sys.argv[3])
    except IndexError:
        tagKey = 'Error'
    return tagKey

def getResult(filename,seekfile,tagkey):
    destPos = prePos(seekfile)
    curPos = lastPos(filename)

    if curPos < destPos:
        curpos = 0

    try:
        f = open(filename)
    except IOError:
        print('Could not open file: %s' % filename)
    except FileNotFoundError:
        print('Could not open file: %s' % filename)
    else:
        f.seek(destPos)

        while curPos != 0 and f.tell() < curPos:
            rresult = f.readline().strip()
            global result
            if re.search(tagkey, rresult):
                result = 1
                break
            else:
                result = 0

        with open(seekfile,'w') as sf:
            sf.write(str(curPos))
    finally:
        f.close()
    return result

if __name__ == "__main__":
    result = 0
    curpos = 0
    tagkey = getKey()
    seekfile = getSeekFile()
    result = getResult(sys.argv[1],seekfile,tagkey)
    print(result)

[root@web scripts]# ls
check_process.sh  log.py
[root@web scripts]# ll
total 8
-rwxr-xr-x 1 root root  172 Sep  7 01:20 check_process.sh
-rw-r--r-- 1 root root 1947 Sep  7 07:54 log.py
[root@web scripts]# chmod +x log.py
[root@web scripts]# ll
total 8
-rwxr-xr-x 1 root root  172 Sep  7 01:20 check_process.sh
-rwxr-xr-x 1 root root 1947 Sep  7 07:54 log.py
#dos2unix这个包进行转换
[root@web scripts]# dos2unix log.py
dos2unix: converting file log.py to Unix format...

//测试一下该脚本是否可用,0代表没问题
[root@web ~]# /scripts/log.py /var/log/httpd/error_log
0


执行脚本检查httpd的错误日志
[root@web ~]# /scripts/log.py /var/log/httpd/error_log
0


//手动添加错误信息"Error"测试效果
[root@web ~]# echo 'Error' >> /var/log/httpd/error_log

//可以看到输出了1,1代表日志文件里有报错
[root@web ~]# /scripts/log.py /var/log/httpd/error_log
1
2.2在agent端编辑配置文件
[root@web ~]# vim /usr/local/etc/zabbix_agentd.conf
#在最下面创建这个命令
# ListenBacklog=

# Mandatory: no
# Default:
UserParameter=check_logs[*],/usr/bin/python3 /scripts/log.py $1 $2 $3
//添加这行

#重启agent,生效配置
[root@web ~]# pkill zabbix_agentd
[root@web ~]# zabbix_agentd
[root@web ~]# ss -anlt
State      Recv-Q      Send-Q           Local Address:Port            Peer Address:Port     Process
LISTEN     0           128                    0.0.0.0:10050                0.0.0.0:*
LISTEN     0           128                    0.0.0.0:22                   0.0.0.0:*
LISTEN     0           128                       [::]:22                      [::]:*

#生效配置之后,去Server端测试
#测试之前先做些测试的准备工作
#设置文件权限。因为zabbix服务端访问客户端属于其他,如果\
#文件的其他人没有读的权限,则无法监控该项

[root@web ~]# ll /var/log/httpd/error_log
-rw-r--r-- 1 root root 4328 Sep  7 08:10 /var/log/httpd/error_log
[root@web ~]# ll -d /var/log/httpd/
drwx------ 2 root root 41 Sep  7 08:52 /var/log/httpd/
[root@web ~]# chmod 755 /var/log/httpd/
[root@web ~]# ll -d /var/log/httpd/
drwxr-xr-x 2 root root 41 Sep  7 08:52 /var/log/httpd/

#因之前本地测试脚本生成了该文件,该文件的属组是本地的root用户,\
#需本地测试完后删掉,在server执行脚本生成新的文件,删除过程在httpd输入的错误文件
[root@web ~]# rm -rf /var/log/httpd/error_log
[root@web ~]# systemctl restart httpd
[root@web ~]# /scripts/log.py /var/log/httpd/error_log
0
[root@web ~]# ll /tmp/logseek
-rw-r--r--  1 root   root       4 Sep  7 10:08 logseek
[root@web ~]# rm -rf /tmp/logseek

[root@localhost ~]# zabbix_get -s 192.168.141.135 -k check_logs[/var/log/httpd/error_log,/tmp/logseek,error]
0

//去到agent查看新生成的logseek记录检查文件,可以看到属主是zabbix
[root@web ~]# ll /tmp/logseek
-rw-rw-r-- 1 zabbix zabbix 4 Sep  7 10:10 /tmp/logseek
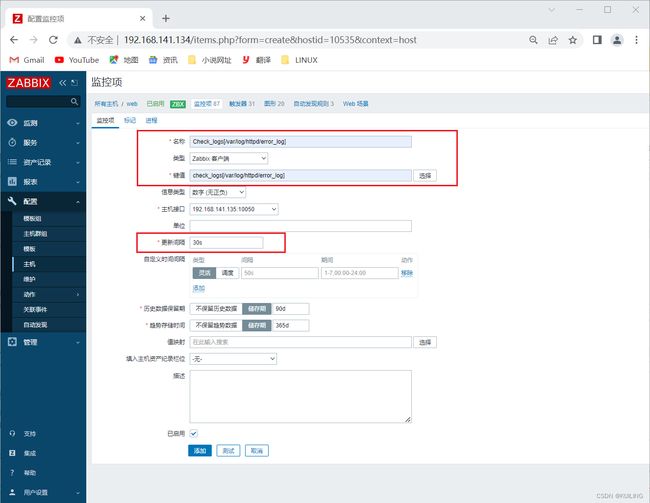
2.3在web界面添加触发器
创建监控项
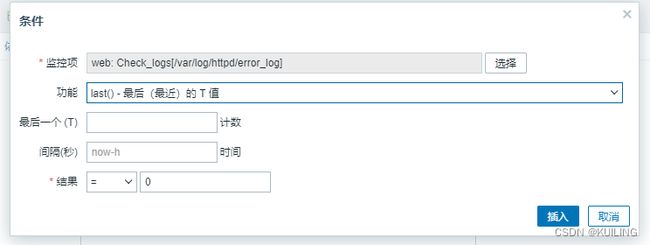
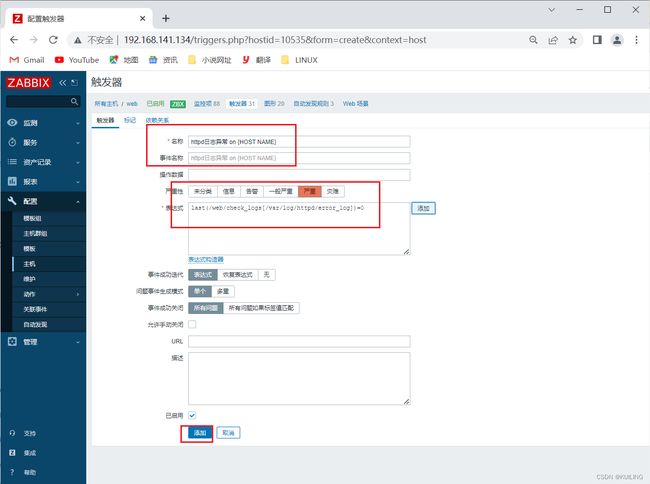
创建触发器


在被监控端手动触发告警
[root@web ~]# echo "Error" >> /var/log/httpd/error_log
[root@web ~]# /scripts/log.py /var/log/httpd/error_log
1
在个人的邮箱查看是否有问题报警发到邮箱
