Python图像处理【9】使用高通滤波器执行边缘检测
使用高通滤波器执行边缘检测
-
- 0. 前言
- 1. 高通滤波器频率响应函数
- 2. 利用 HPF 执行边缘检测
- 小结
- 系列链接
0. 前言
高通滤波器 (High Pass Filters, HPF) 是一系列滤波器,这些滤波器仅允许来自图像频率响应(使用 DFT 获取)的高频部分通过,并过滤所有小于截止值的低频部分。使用逆 DFT 重建图像时,由于高频分量对应于边缘/细节等,因此利用 HPF 可以提取或增强图像中的边缘/细节。在本节中,我们将学习如何使用 OpenCV 的 FFT 模块实现 HPF 检测图像中对象边缘,例如 Ideal、Gaussian 和 Butterworth HPF。
1. 高通滤波器频率响应函数
下表中给出了几种常用高通滤波器 (High Pass Filters, HPF) 的频率响应函数 H:
| Ideal HPF | Gaussian HPF | Butterworth HPF |
|---|---|---|
| H ( u , v ) = { 0 D ( u , v ) ≤ D 0 1 D ( u , v ) > D 0 H(u,v)=\left\{ \begin{array}{rcl} 0 & & {D(u,v) ≤ D_0}\\ 1 & & {D(u,v)>D_0} \end{array} \right. H(u,v)={01D(u,v)≤D0D(u,v)>D0 | H ( u , v ) = 1 − e − D 2 ( u , v ) / 2 D 0 2 H(u,v)=1-e^{-D^2(u,v)/2D^2_0} H(u,v)=1−e−D2(u,v)/2D02 | H ( u , v = 1 1 + ( D 0 D ( u , v ) ) 2 n H(u,v=\frac 1 {1+(\frac {D_0}{D(u,v)})^{2n}} H(u,v=1+(D(u,v)D0)2n1 |
其中, D ( u , v ) = u 2 + v 2 D(u,v)=\sqrt {u^2+v^2} D(u,v)=u2+v2, D 0 D_0 D0 为截止频率, n n n 为滤波器度。接下来,我们使用 OpenCV FFT/IFFT 函数实现以上的 HPF。
2. 利用 HPF 执行边缘检测
(1) 我们首先定义函数 dft2() 以实现 2D DFT,该函数执行以下操作:
- 将输入图像转换为浮点类型
- 使用
cv2.dft()函数应用DFT获取输出 - 将原点从左上角转移到图像的中心
- 提取振幅和相位图像,并返回
import cv2
import numpy as np
import matplotlib.pyplot as plt
from mpl_toolkits.axes_grid1 import make_axes_locatable
from matplotlib.ticker import LinearLocator, FormatStrFormatter
from skimage.color import rgb2gray

def dft2(im):
    freq = cv2.dft(np.float32(im), flags = cv2.DFT_COMPLEX_OUTPUT)
    freq_shift = np.fft.fftshift(freq)
    mag, phase = freq_shift[:,:,0], freq_shift[:,:,1]
    return mag + 1j*phase
(2) 现在,定义函数 idft2() 以计算 2D-IDFT,该函数执行以下操作:
- 根据复杂功率谱输入中分离幅度和相位
- 将幅度提高到接近
1的次方,大于1的值会增加对比度,小于1的值会降低对比度 - 将幅度和相位转换为笛卡尔实分量和虚分量
- 将笛卡尔分量组合成一个图像
- 将原点从图像中心移到左上角
- 使用
cv2.idft()计算IDFT以获得输出 - 将输出组合到空间域图像中
函数 cv2.idft() 计算 1D 或 2D 数组的反离散傅立叶变换,调用方式如下所示:
cv2.idft(src, flags, nonzeroRows)
默认情况下,cv2.dft() 和 cv2.idft() 并不会缩放结果。因此,我们需要将 DFT_SCALE 显式传递给 cv2.dft() 或 cv2.idft(),以使这些变换互逆:
def idft2(freq):
    real, imag = freq.real, freq.imag
    back = cv2.merge([real, imag])
    back_ishift = np.fft.ifftshift(back)
    im = cv2.idft(back_ishift, flags=cv2.DFT_SCALE)
    im = cv2.magnitude(im[:,:,0], im[:,:,1])
    return im
(3) 接下来,我们使用前言中介绍的公式实现 HPF,对于给定的截止频率 D 0 D_0 D0,每个函数都接受核大小参数 sz:
def ideal(sz, D0):
    h, w = sz
    u, v = np.meshgrid(range(-w//2,w//2), range(-h//2,h//2)) #, sparse=True)
    return np.sqrt(u**2 + v**2) > D0

def gaussian(sz, D0):
    h, w = sz
    u, v = np.meshgrid(range(-w//2,w//2), range(-h//2,h//2)) #, sparse=True)
    return 1-np.exp(-(u**2 + v**2)/(2*D0**2))

def butterworth(sz, D0, n=1):
    h, w = sz
    u, v = np.meshgrid(range(-w//2,w//2), range(-h//2,h//2)) #, sparse=True)
    return 1 / (1 + (D0/(0.01+np.sqrt(u**2 + v**2)))**(2*n))
(4) 实现函数 plot_HPF(),该函数接受输入图像、HPF 函数和截止频率列表,以绘制通过在输入图像上应用 HPF 获得的输入/输出图像、以及不同截止值的 HPF 功率谱:
def plot_HPF(im, f, D0s):
    freq = dft2(im)
    fig = plt.figure(figsize=(20,20))
    plt.subplots_adjust(0,0,1,0.95,0.05,0.05)
    i = 1
    for D0 in D0s:
        freq_kernel = f(im.shape, D0)
        convolved = freq*freq_kernel # by the Convolution theorem
        im_convolved = idft2(convolved).real
        im_convolved = (255 * im_convolved / np.max(im_convolved)).astype(np.uint8)
        plt.subplot(2,2,i)
        last_axes = plt.gca()
        img = plt.imshow((20*np.log10(0.01 + freq_kernel)).astype(int), cmap='coolwarm')
        divider = make_axes_locatable(img.axes)
        cax = divider.append_axes("right", size="5%", pad=0.05)
        fig.colorbar(img, cax=cax)
        plt.sca(last_axes), plt.title('{} HPF Kernel (freq)'.format(f.__name__), size=10)
        plt.subplot(2,2,i+2), plt.imshow(im_convolved), plt.axis('off')
        plt.title(r'output with {} HPF ($D_0$={})'.format(f.__name__, D0), size=10)
        i += 1
    plt.show()
(5) 实现函数 plot_HPF_3d() 以绘制对应于输出图像的 3D 频率响应,输出图像通过在输入图像上应用由一组截止频率参数化的给定 HPF 函数获得:
def plot_HPF_3d(im, f, D0s):
    freq = dft2(im)
    fig = plt.figure(figsize=(20,10))
    plt.subplots_adjust(0,0,1,0.95,0.05,0.05)
    i = 1
    for D0 in D0s:
        freq_kernel = f(im.shape, D0)
        convolved = freq*freq_kernel # by the Convolution theorem
        Y = np.arange(freq_kernel.shape[0])
        X = np.arange(freq_kernel.shape[1])
        X, Y = np.meshgrid(X, Y)
        Z = (20*np.log10( 0.01 + convolved)).real
        ax = fig.add_subplot(1, 2, i, projection='3d')
        surf = ax.plot_surface(X, Y, Z, cmap=plt.cm.coolwarm, linewidth=0, antialiased=False)
        ax.zaxis.set_major_locator(LinearLocator(10)), ax.zaxis.set_major_formatter(FormatStrFormatter('%.02f'))
        ax.set_xlabel('F1', size=15), ax.set_ylabel('F2', size=15)
        plt.title(r'output with {} HPF (freq)'.format(f.__name__, D0), size=10)
        fig.colorbar(surf, shrink=0.5, aspect=10)
        i += 1
    plt.show()
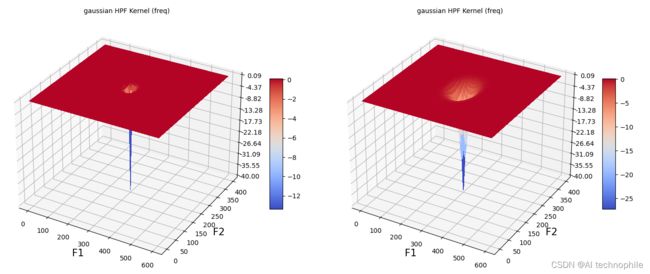
(6) 给定核大小和截止频率,实现函数 plot_filter_3d() 绘制 HPF 核的 3D 功率谱:
def plot_filter_3d(sz, f, D0s, cmap=plt.cm.coolwarm):
    fig = plt.figure(figsize=(20,10))
    plt.subplots_adjust(0,0,1,0.95,0.05,0.05)
    i = 1
    for D0 in D0s:
        freq_kernel = f(sz, D0)
        Y = np.arange(freq_kernel.shape[0])
        X = np.arange(freq_kernel.shape[1])
        X, Y = np.meshgrid(X, Y)
        Z = (20*np.log10( 0.01 + freq_kernel)).real
        ax = fig.add_subplot(1, 2, i, projection='3d')
        surf = ax.plot_surface(X, Y, Z, cmap=cmap, linewidth=0, antialiased=False)
        ax.zaxis.set_major_locator(LinearLocator(10))
        ax.zaxis.set_major_formatter(FormatStrFormatter('%.02f'))
        ax.set_xlabel('F1', size=15)
        ax.set_ylabel('F2', size=15)
        ax.set_title('{} HPF Kernel (freq)'.format(f.__name__), size=10)
        fig.colorbar(surf, shrink=0.5, aspect=10)
        i += 1
(7) 绘制原始输入图像:
im = plt.imread('1.png')
im = rgb2gray(im)
plt.figure(figsize=(7,12))
plt.imshow(im, cmap='gray'), plt.axis('off'), plt.title('original image')
plt.show()
(8) 我们使用不同的截止频率值的 HPF,绘制 Ideal HPF 和输入/输出图像的频率响应:
D0 = [10, 30]

plot_HPF(im, ideal, D0)
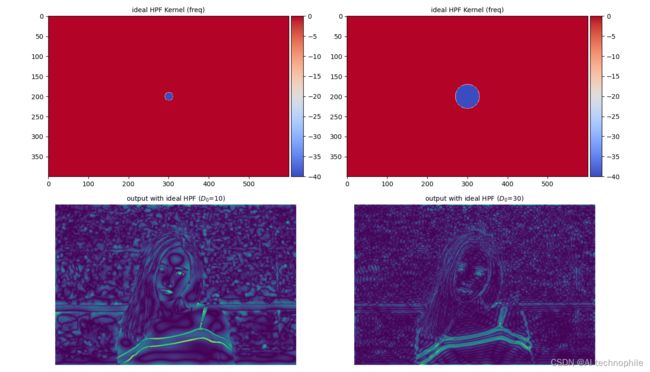
从上图中可以看出,Ideal HPF 减弱了图像中的低频部分,由于函数值的 0-1 突变导致了图像中出现了之振铃伪影。
(9) 接下来,我们使用函数 plot_hpf_3d() 绘制输出图像的频率响应:
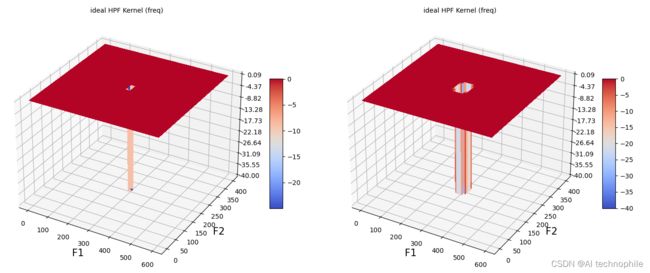
plot_filter_3d(im.shape, ideal, D0)
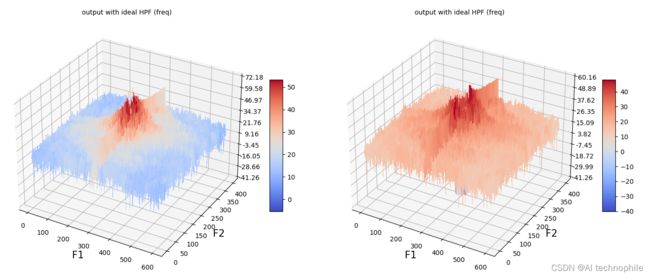
(10) 使用函数 plot_filter_3d() 绘制不同截止值的 Ideal HPF 核的功率谱:
plot_filter_3d(im.shape, ideal, D0)
(11) 接下来,使用 plot_hpf() 函数绘制 Gaussian HPF 和输入/输出图像的频率响应:
plot_HPF(im, gaussian, D0)
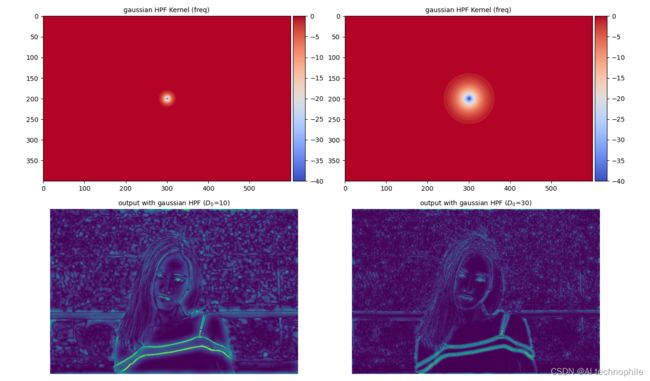
从上图可以看出,高斯 HPF 过滤了图像中的低频分量;同时,它消除了使用 Ideal HPF 导致的振铃伪影。
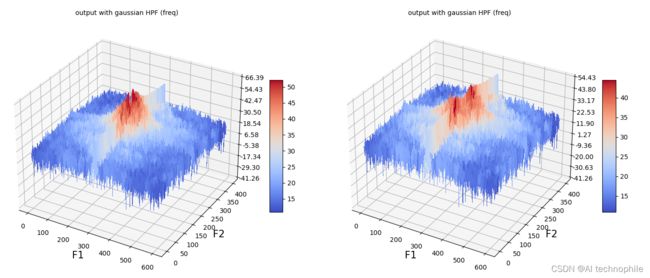
(12) 接下来,使用函数 plot_hpf_3d() 绘制输出图像的频率响应:
plot_HPF_3d(im, gaussian, D0)
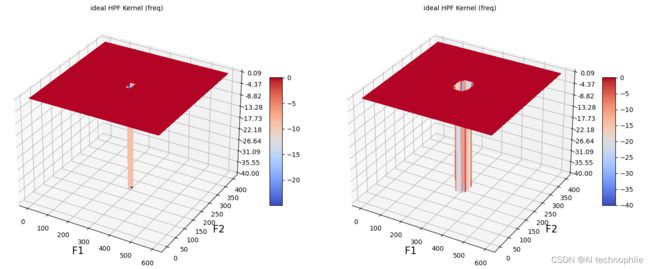
(13) 使用函数 plot_filter_3d() 绘制不同截止值的 Gaussian HPF 核的功率谱:
plot_filter_3d(im.shape, gaussian, D0)
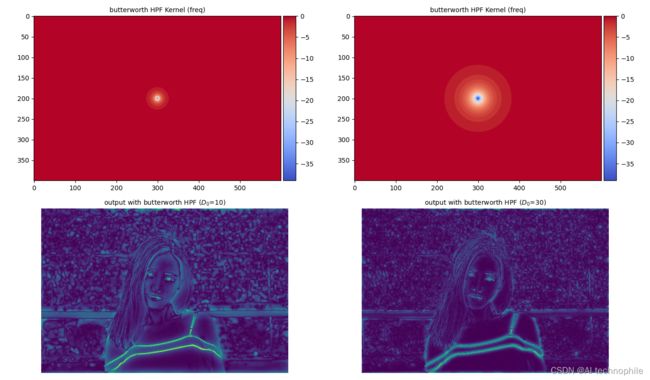
(14) 接下来,用 plot_hpf() 函数绘制 Butterworth HPF 和输入/输出图像的频率响应:
plot_HPF(im, butterworth, D0)
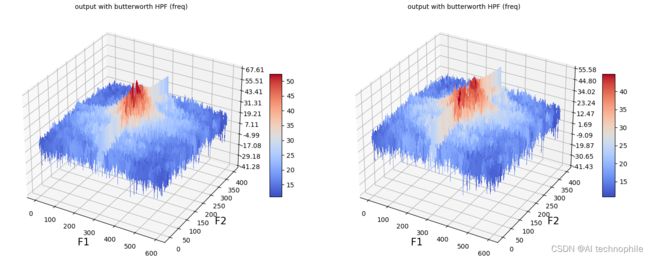
(15) 使用函数 plot_hpf_3d() 绘制输出图像的频率响应:
plot_HPF_3d(im, butterworth, D0)
(16) 使用函数 plot_filter_3d() 绘制不同截止值的 Butterworth HPF 核的功率谱:
plot_filter_3d(im.shape, butterworth, D0)
小结
高通滤波器可以允许高于给定阈值的频率信息通过,而过滤掉低于该阈值的频率信息,从而大大衰减低频率的一种滤波器。在图像处理中,过滤频率信息采用的是傅里叶变换,把图像从空域转为频域进行处理。在本节中,我们学习了如何使用高通滤波器执行边缘检测,使用 OpenCV 的 FFT 模块实现 HPF 检测图像中对象边缘。
系列链接
Python图像处理【1】图像与视频处理基础
Python图像处理【2】探索Python图像处理库
Python图像处理【3】Python图像处理库应用
Python图像处理【4】图像线性变换
Python图像处理【5】图像扭曲/逆扭曲
Python图像处理【6】通过哈希查找重复和类似的图像
Python图像处理【7】采样、卷积与离散傅里叶变换
Python图像处理【8】使用低通滤波器模糊图像

