机器学习 实验二:支持向量机
介绍
在本实验中,将使用支持向量机(Support Vector Machine, SVM)并了解其在数据上的工作原理。
本次实验需要用到的数据集包括:
- ex2data1.mat -线性SVM分类数据集
- ex2data2.mat -高斯核SVM分类数据集
- ex2data3.mat -交叉验证高斯核SVM分类数据集
评分标准如下:
- 要点1:使用线性SVM-----------------(20分)
- 要点2:定义高斯核---------------------(20分)
- 要点3:使用高斯核SVM---------------(20分)
- 要点4:搜索SVM最优参数------------(20分)
- 要点5:手写体数字识别---------------(20分)
In [120]:
# 引入所需要的库文件
import numpy as np
import pandas as pd
import matplotlib.pyplot as plt
from scipy.io import loadmat
import os

%matplotlib inline
1 线性SVM
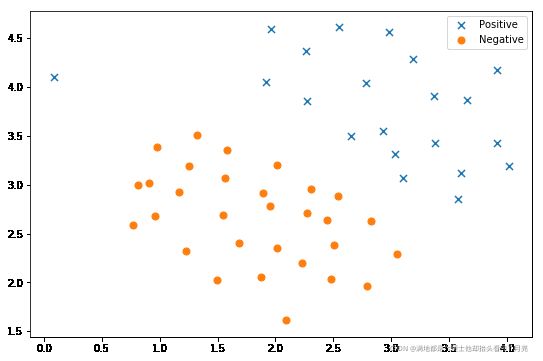
在该部分实验中,将实现线性SVM分类并将其应用于数据集1。
In [121]:
raw_data = loadmat('ex2data1.mat')
data = pd.DataFrame(raw_data.get('X'), columns=['X1', 'X2'])
data['y'] = raw_data.get('y')

data.head()
Out[121]:
| X1 | X2 | y | |
|---|---|---|---|
| 0 | 1.9643 | 4.5957 | 1 |
| 1 | 2.2753 | 3.8589 | 1 |
| 2 | 2.9781 | 4.5651 | 1 |
| 3 | 2.9320 | 3.5519 | 1 |
| 4 | 3.5772 | 2.8560 | 1 |
In [122]:
# 定义数据可视化函数
def plot_init_data(data, fig, ax):
    positive = data[data['y'].isin([1])]
    negative = data[data['y'].isin([0])]

    ax.scatter(positive['X1'], positive['X2'], s=50, marker='x', label='Positive')
    ax.scatter(negative['X1'], negative['X2'], s=50, marker='o', label='Negative')
In [123]:
# 数据可视化
fig, ax = plt.subplots(figsize=(9,6))
plot_init_data(data, fig, ax)
ax.legend()
plt.show()
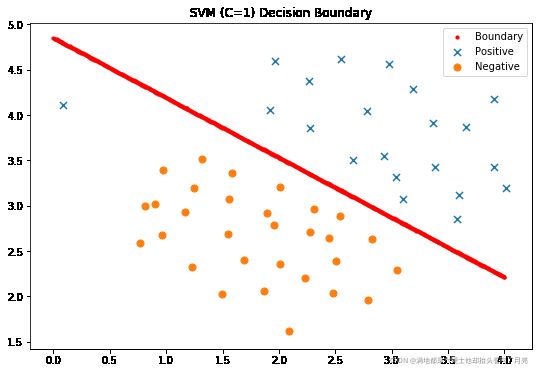
**要点 1:** 本部分的**任务为使用线性SVM于数据集1:`ex2data1.mat`。** 可调用sklearn库实现SVM功能。
In [124]:
from sklearn import svm
# ====================== 在这里填入代码 =======================
svc = svm.SVC(kernel="linear")
svc.fit(data[['X1', 'X2']], data['y'])
svc.score(data[['X1', 'X2']], data['y'])
# =============================================================
Out[124]:
0.9803921568627451
In [125]:
#定义可视化分类边界函数
def find_decision_boundary(svc, x1min, x1max, x2min, x2max, diff):
    x1 = np.linspace(x1min, x1max, 1000)
    x2 = np.linspace(x2min, x2max, 1000)

    cordinates = [(x, y) for x in x1 for y in x2]
    x_cord, y_cord = zip(*cordinates)
    c_val = pd.DataFrame({'x1':x_cord, 'x2':y_cord})
    c_val['cval'] = svc.decision_function(c_val[['x1', 'x2']])

    decision = c_val[np.abs(c_val['cval']) < diff]

    return decision.x1, decision.x2
In [126]:
#显示分类决策面
x1, x2 = find_decision_boundary(svc, 0, 4, 1.5, 5, 2 * 10**-3)
fig, ax = plt.subplots(figsize=(9,6))
ax.scatter(x1, x2, s=10, c='r',label='Boundary')
plot_init_data(data, fig, ax)
ax.set_title('SVM (C=1) Decision Boundary')
ax.legend()
plt.show()
In [127]:
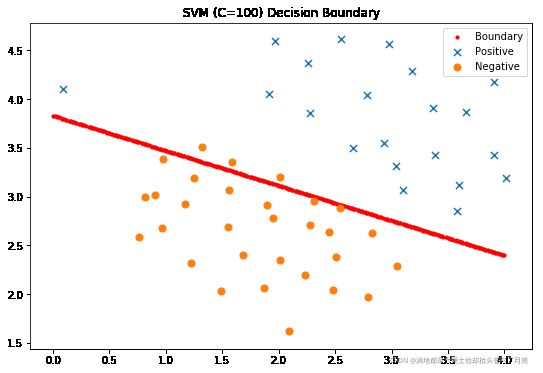
#尝试C=100
svc2 = svm.LinearSVC(C=100, loss='hinge', max_iter=1000)
svc2.fit(data[['X1', 'X2']], data['y'])
svc2.score(data[['X1', 'X2']], data['y'])
/opt/conda/lib/python3.6/site-packages/sklearn/svm/base.py:931: ConvergenceWarning: Liblinear failed to converge, increase the number of iterations. "the number of iterations.", ConvergenceWarning)
Out[127]:
0.9411764705882353
In [128]:
#显示分类决策面
x1, x2 = find_decision_boundary(svc2, 0, 4, 1.5, 5, 2 * 10**-3)
fig, ax = plt.subplots(figsize=(9,6))
ax.scatter(x1, x2, s=10, c='r',label='Boundary')
plot_init_data(data, fig, ax)
ax.set_title('SVM (C=100) Decision Boundary')
ax.legend()
plt.show()
2 高斯核 SVM
在本部分实验中,将利用核SVM实现非线性分类任务。
2.1 高斯核
对于两个样本x1,x2∈Rdx1,x2∈Rd,其高斯核定义为
Kgaussian(x1,x2)=exp(−∥x1−x2∥222σ2)Kgaussian(x1,x2)=exp(−‖x1−x2‖222σ2)
**要点 2:** 本部分的**任务为按照上述公式实现高斯核函数的定义。**
In [129]:
def gaussianKernel(x1, x2, sigma):
    """
    定义高斯核.

    输入参数
    ----------
    x1 :  第一个样本点,大小为(d,1)的向量

    x2 :  第二个样本点,大小为(d,1)的向量

    sigma : 高斯核的带宽参数

    输出结果
    -------
    sim : 两个样本的相似度 (similarity)。

    """
# ====================== 在这里填入代码 =======================
    sim=np.exp(-np.power(x1-x2, 2).sum()/(2*sigma**2))

# =============================================================
    return sim
如果完成了上述的高斯核函数 gaussianKernel,以下代码可用于测试。如果结果为0.324652,则计算通过。
In [130]:
#测试高斯核函数
x1 = np.array([1, 2, 1])
x2 = np.array([0, 4, -1])
sigma = 2

sim = gaussianKernel(x1, x2, sigma)

print('Gaussian Kernel between x1  and x2 is :', sim)
Gaussian Kernel between x1 and x2 is : 0.32465246735834974
2.2 高斯核SVM应用于数据集2
在本部分实验中,将高斯核SVM应用于数据集2:ex2data2.mat。。
In [131]:
raw_data = loadmat('ex2data2.mat')

data = pd.DataFrame(raw_data['X'], columns=['X1', 'X2'])
data['y'] = raw_data['y']

fig, ax = plt.subplots(figsize=(9,6))
plot_init_data(data, fig, ax)
ax.legend()
plt.show()
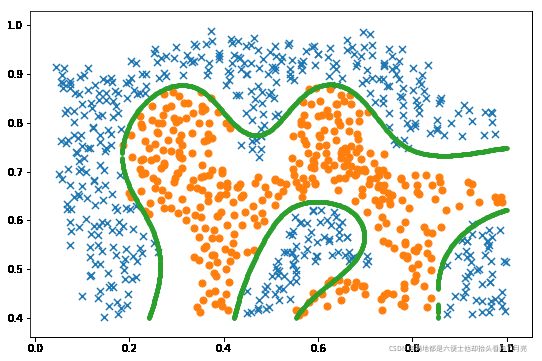
从上图中可看出,上述两类样本是线性不可分的。需要采用核SVM进行分类。
**要点 3:** 本部分的**任务为使用高斯核SVM于数据集2。** 可调用sklearn库实现非线性SVM功能。
In [132]:
# ====================== 在这里填入代码 =======================
svc = svm.SVC( kernel='rbf', gamma=30)
svc.fit(data[['X1', 'X2']], data['y'])
svc.score(data[['X1', 'X2']], data['y'])

# =============================================================
Out[132]:
0.9721900347624566
In [133]:
x1, x2 = find_decision_boundary(svc, 0, 1, 0.4, 1, 0.01)
fig, ax = plt.subplots(figsize=(9,6))
plot_init_data(data, fig, ax)
ax.scatter(x1, x2, s=10)
plt.show()
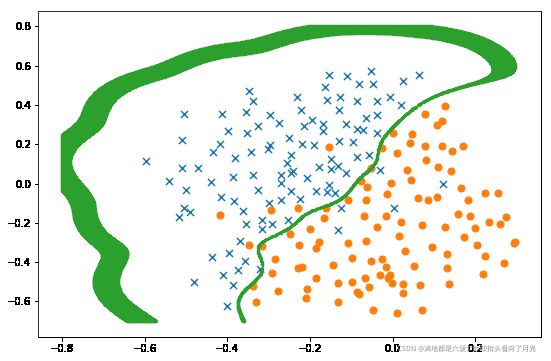
3 交叉验证高斯核 SVM
在本部分实验中,将通过交叉验证方法选择高斯核SVM的最优参数CC和σσ,并将其应用于数据集3:ex2data3.mat。 该数据集包含训练样本集X(训练样本特征), y(训练样本标记)和验证集 Xval(验证样本特征), yval(验证样本标记)。
In [134]:
raw_data = loadmat('ex2data3.mat')

X = raw_data['X']
Xval = raw_data['Xval']
y = raw_data['y'].ravel()
yval = raw_data['yval'].ravel()

fig, ax = plt.subplots(figsize=(9,6))
data = pd.DataFrame(raw_data.get('X'), columns=['X1', 'X2'])
data['y'] = raw_data.get('y')
plot_init_data(data, fig, ax)
plt.show()
3.1 搜索SVM最优参数 CC 和 σσ
**要点 4:** 本部分的**任务为搜索SVM最优参数CC和σσ。** 对于CC和σσ,可从以下候选集合中搜索 {0.01,0.03,0.1,0.3,1,3,10,30}{0.01,0.03,0.1,0.3,1,3,10,30}
In [135]:
C_values = [0.01, 0.03, 0.1, 0.3, 1, 3, 10, 30, 100]
gamma_values = [0.01, 0.03, 0.1, 0.3, 1, 3, 10, 30, 100]

best_score = 0

# ====================== 在这里填入代码 =======================
dataval = pd.DataFrame(raw_data.get('Xval'), columns=['X1', 'X2'])
dataval['y'] = raw_data.get('yval')
for c in C_values:
    for gamma in gamma_values:
        svc = svm.SVC(C=c, gamma=gamma)
        svc.fit(data[['X1', 'X2']], data['y'])
        score =svc.score(dataval[['X1', 'X2']], dataval['y'])
        if score>best_score:
            best_score=score
            best_C=c
            best_gamma=gamma


# =============================================================

best_C, best_gamma, best_score
Out[135]:
(0.3, 100, 0.965)
3.2 利用已选出的参数和高斯核SVM应用于数据集3
In [136]:
svc = svm.SVC(C=best_C, gamma=best_gamma)
svc.fit(X, y)

x1, x2 = find_decision_boundary(svc, -0.8, 0.3, -0.7, 0.8, 0.005)
fig, ax = plt.subplots(figsize=(9,6))
plot_init_data(data, fig, ax)
ax.scatter(x1, x2, s=5)
plt.show()
4 将 SVM 应用于手写体数字识别
在本部分实验中,将线性SVM和高斯核SVM应用于手写体数据集:UCI ML hand-written digits datasets,并对比识别结果。
In [137]:
# 引入所需要的库文件
from sklearn import datasets, svm, metrics
from sklearn.model_selection import train_test_split
In [138]:
# 从sklearn库中下载数据集并展示部分样本
digits = datasets.load_digits()

_, axes = plt.subplots(1, 10)
images_and_labels = list(zip(digits.images, digits.target))
for ax, (image, label) in zip(axes, images_and_labels[0:10]):
    ax.set_axis_off()
    ax.imshow(image, cmap=plt.cm.gray_r, interpolation='nearest')
    ax.set_title(' %i' % label)
plt.show()
In [139]:
将每个图片样本变成向量
n_samples = len(digits.images)
data = digits.images.reshape((n_samples, -1))

# 将原始数据集划分成训练集和测试集(一半训练,另一半做测试)
X_train, X_test, y_train, y_test = train_test_split(
    data, digits.target, test_size=0.5, shuffle=False)#False
**要点 5:** 本部分的任务为**将线性SVM(C=1)和高斯核SVM(C=1, gamma=0.001)应用于UCI手写体数据集并输出识别精度。**
In [140]:
#将线性SVM应用于该数据集并输出识别结果
# ====================== 在这里填入代码 =======================
svc = svm.SVC(kernel="linear")
svc.fit(X_train, y_train)
score_Linear=svc.score(X_test, y_test)
# =============================================================

print("Classification accuracy of Linear SVM:", score_Linear)
Classification accuracy of Linear SVM: 0.9443826473859844
In [141]:
#将线性SVM应用于该数据集并输出识别结果
# ====================== 在这里填入代码 =======================
svc = svm.SVC(kernel="linear")
svc.fit(X_train, y_train)
score_Linear=svc.score(X_test, y_test)
# =============================================================

print("Classification accuracy of Linear SVM:", score_Linear)
Classification accuracy of Gaussian SVM: 0.9688542825361512
