在多个尺度下生成不同数量和不同大小的锚框,从而在多个尺度下检测不同大小的目标。附加调通《动手学深度学习》课堂数据加载代码,为目标检测实战作准备
-
在实验中【深一点学习】目标检测任务。从人工标注框开始,经过目标框的转换(xyxy,CxCyhw),到回归于分类综合促成的目标检测结果和非极大值抑制的后处理方法的实现,原理分析,代码实践_羞儿的博客-CSDN博客以输入图像的每个像素为中心生成多个锚框。这些锚框是对输入图像不同区域的采样。然而,如果以图像每个像素为中心都生成锚框,很容易生成过多锚框而造成计算量过大。举个例子,假设输入图像的高和宽分别为500像素和700像素,如果以每个像素为中心生成5个不同形状的锚框,那么一张图像上则需要标注并预测175多万个锚框(500*700*5)。
-
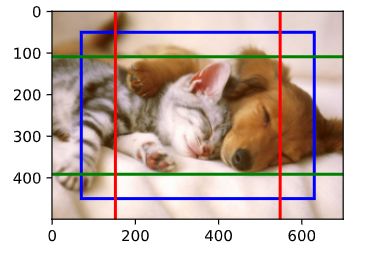
减少锚框个数并不难。一种简单的方法是在输入图像中均匀采样一小部分像素,并以采样的像素为中心生成锚框。此外,在不同尺度下,我们可以生成不同数量和不同大小的锚框。值得注意的是,较小目标比较大目标在图像上出现位置的可能性更多。举个简单的例子:形状为 1 ∗ 1 , 1 ∗ 2 1*1,1*2 1∗1,1∗2 和 2 ∗ 2 2*2 2∗2的目标在形状为 2 ∗ 2 2*2 2∗2的图像上可能出现的位置分别有4、2和1种。因此,当使用较小锚框来检测较小目标时,我们可以采样较多的区域;而当使用较大锚框来检测较大目标时,我们可以采样较少的区域。为了演示如何多尺度生成锚框,我们先读取一张图像。它的高和宽分别为500像素和700像素。13.5. 多尺度目标检测 — 动手学深度学习 2.0.0 documentation (d2l.ai)
-
我们可以通过定义特征图的形状来确定任一图像上均匀采样的锚框中心。下面定义
display_anchors函数。我们在特征图fmap上以每个单元(像素)为中心生成锚框anchors。由于锚框anchors中 x x x 和 y y y 轴的坐标值分别已除以特征图fmap的宽和高,这些值域在0和1之间的值表达了锚框在特征图中的相对位置。由于锚框anchors的中心遍布特征图fmap上的所有单元,anchors的中心在任一图像的空间相对位置一定是均匀分布的。具体来说,当特征图的宽和高分别设为fmap_w和fmap_h时,该函数将在任一图像上均匀采样fmap_h行fmap_w列个像素,并分别以它们为中心生成大小为s(假设列表s长度为1)的不同宽高比(ratios)的锚框。 -
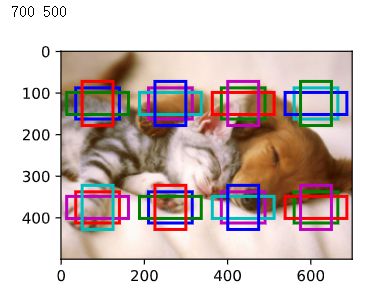
%matplotlib inline from PIL import Image import numpy as np import torch import math import sys img = Image.open('../../data/catdog.jpg') w, h = img.size print(w, h) import matplotlib_inline import matplotlib.pyplot as plt def set_figsize(figsize=(3.5, 2.5)): use_svg_display() # 设置图的尺寸 plt.rcParams['figure.figsize'] = figsize def use_svg_display(): """Use svg format to display plot in jupyter""" matplotlib_inline.backend_inline.set_matplotlib_formats('svg') set_figsize() def bbox_to_rect(bbox, color): # 将边界框(左上x, 左上y, 右下x, 右下y)格式转换成matplotlib格式: # ((左上x, 左上y), 宽, 高) return plt.Rectangle( xy=(bbox[0], bbox[1]), width=bbox[2]-bbox[0], height=bbox[3]-bbox[1], fill=False, edgecolor=color, linewidth=2) def MultiBoxPrior(feature_map, sizes=[0.75, 0.5, 0.25], ratios=[1, 2, 0.5]): """ # 按照「9.4.1. 生成多个锚框」所讲的实现, anchor表示成(xmin, ymin, xmax, ymax). https://zh.d2l.ai/chapter_computer-vision/anchor.html Args: feature_map: torch tensor, Shape: [N, C, H, W]. sizes: List of sizes (0~1) of generated MultiBoxPriores. ratios: List of aspect ratios (non-negative) of generated MultiBoxPriores. Returns: anchors of shape (1, num_anchors, 4). 由于batch里每个都一样, 所以第一维为1 """ pairs = [] # pair of (size, sqrt(ration)) for r in ratios: pairs.append([sizes[0], math.sqrt(r)]) for s in sizes[1:]: pairs.append([s, math.sqrt(ratios[0])]) pairs = np.array(pairs) ss1 = pairs[:, 0] * pairs[:, 1] # size * sqrt(ration) ss2 = pairs[:, 0] / pairs[:, 1] # size / sqrt(ration) base_anchors = np.stack([-ss1, -ss2, ss1, ss2], axis=1) / 2 h, w = feature_map.shape[-2:] shifts_x = np.arange(0, w) / w shifts_y = np.arange(0, h) / h shift_x, shift_y = np.meshgrid(shifts_x, shifts_y) shift_x = shift_x.reshape(-1) shift_y = shift_y.reshape(-1) shifts = np.stack((shift_x, shift_y, shift_x, shift_y), axis=1) anchors = shifts.reshape((-1, 1, 4)) + base_anchors.reshape((1, -1, 4)) return torch.tensor(anchors, dtype=torch.float32).view(1, -1, 4) def show_bboxes(axes, bboxes, labels=None, colors=None): def _make_list(obj, default_values=None): if obj is None: obj = default_values elif not isinstance(obj, (list, tuple)): obj = [obj] return obj labels = _make_list(labels) colors = _make_list(colors, ['b', 'g', 'r', 'm', 'c']) for i, bbox in enumerate(bboxes): color = colors[i % len(colors)] rect = bbox_to_rect(bbox.detach().cpu().numpy(), color) axes.add_patch(rect) if labels and len(labels) > i: text_color = 'k' if color == 'w' else 'w' axes.text(rect.xy[0], rect.xy[1], labels[i], va='center', ha='center', fontsize=6, color=text_color, bbox=dict(facecolor=color, lw=0)) def display_anchors(fmap_w, fmap_h, s): # 前两维的取值不影响输出结果(原书这里是(1, 10, fmap_w, fmap_h), 我认为错了) fmap = torch.zeros((1, 10, fmap_h, fmap_w), dtype=torch.float32) # 平移所有锚框使均匀分布在图片上 offset_x, offset_y = 1.0/fmap_w, 1.0/fmap_h anchors = MultiBoxPrior(fmap, sizes=s, ratios=[1, 2, 0.5]) + \ torch.tensor([offset_x/2, offset_y/2, offset_x/2, offset_y/2]) bbox_scale = torch.tensor([[w, h, w, h]], dtype=torch.float32) show_bboxes(plt.imshow(img).axes, anchors[0] * bbox_scale) display_anchors(fmap_w=4, fmap_h=2, s=[0.15]) -
我们先关注小目标的检测。为了在显示时更容易分辨,这里令不同中心的锚框不重合:设锚框大小为0.15,特征图的高和宽分别为2和4。可以看出,图像上2行4列的锚框中心分布均匀。我们将特征图的高和宽分别减半,并用更大的锚框检测更大的目标。当锚框大小设0.4时,有些锚框的区域有重合。
-
display_anchors(fmap_w=2, fmap_h=1, s=[0.4]) -
最后,我们将特征图的宽进一步减半至1,并将锚框大小增至0.8。此时锚框中心即图像中心。
-
display_anchors(fmap_w=1, fmap_h=1, s=[0.8]) -
既然我们已在多个尺度上生成了不同大小的锚框,相应地,我们需要在不同尺度下检测不同大小的目标。下面我们来介绍一种基于卷积神经网络的方法。在某种规模上,假设我们有 c c c 张形状为 h ∗ w h*w h∗w 的特征图,其中每组都有 a 个中心相同的锚框。 实验的第一个尺度上,给定10个(通道数量)的特征图,我们生成了16组锚框,每组包含3个中心相同的锚框。 接下来,每个锚框都根据真实值边界框来标记了类和偏移量。 在当前尺度下,目标检测模型需要预测输入图像上 h ∗ w h*w h∗w 组锚框类别和偏移量,其中不同组锚框具有不同的中心。
-
假设此处的 c c c 张特征图是CNN基于输入图像的正向传播算法获得的中间输出。 既然每张特征图上都有 h ∗ w h*w h∗w 个不同的空间位置,那么相同空间位置可以看作含有 c c c 个单元。 对感受野的定义,特征图在相同空间位置的个单元在输入图像上的感受野相同: 它们表征了同一感受野内的输入图像信息。 因此,我们可以将特征图在同一空间位置的个单元变换为使用此空间位置生成的个锚框类别和偏移量。 本质上,我们用输入图像在某个感受野区域内的信息,来预测输入图像上与该区域位置相近的锚框类别和偏移量。
-
当不同层的特征图在输入图像上分别拥有不同大小的感受野时,它们可以用于检测不同大小的目标。 例如,我们可以设计一个神经网络,其中靠近输出层的特征图单元具有更宽的感受野,这样它们就可以从输入图像中检测到较大的目标。
-
在多个尺度下,我们可以生成不同尺寸的锚框来检测不同尺寸的目标。通过定义特征图的形状,我们可以决定任何图像上均匀采样的锚框的中心。我们使用输入图像在某个感受野区域内的信息,来预测输入图像上与该区域位置相近的锚框类别和偏移量。我们可以通过深入学习,在多个层次上的图像分层表示进行多尺度目标检测。
-
目标检测领域没有像MNIST和Fashion-MNIST那样的小数据集。 为了快速测试目标检测模型,我们收集并标记了一个小型数据集。 首先,我们拍摄了一组香蕉的照片,并生成了1000张不同角度和大小的香蕉图像。 然后,我们在一些背景图片的随机位置上放一张香蕉的图像。 最后,我们在图片上为这些香蕉标记了边界框。13.6. 目标检测数据集 — 动手学深度学习 2.0.0 documentation (d2l.ai)
-
包含所有图像和CSV标签文件的香蕉检测数据集可以直接从互联网下载。通过
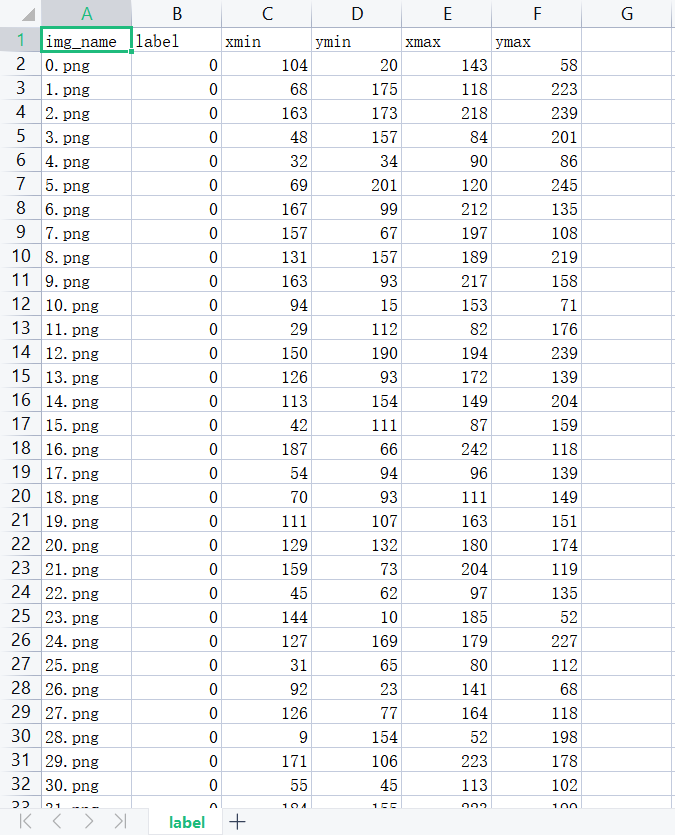
read_data_bananas函数,我们读取香蕉检测数据集。 该数据集包括一个的CSV文件,内含目标类别标签和位于左上角和右下角的真实边界框坐标。通过使用read_data_bananas函数读取图像和标签,以下BananasDataset类别将允许我们创建一个自定义Dataset实例来加载香蕉检测数据集。最后,我们定义load_data_bananas函数,来为训练集和测试集返回两个数据加载器实例。对于测试集,无须按随机顺序读取它。 -
让我们读取一个小批量,并打印其中的图像和标签的形状。 图像的小批量的形状为(批量大小、通道数、高度、宽度),看起来很眼熟:它与我们之前图像分类任务中的相同。 标签的小批量的形状为(批量大小,m,5),其中是数据集的任何图像中边界框可能出现的最大数量。小批量计算虽然高效,但它要求每张图像含有相同数量的边界框,以便放在同一个批量中。 通常来说,图像可能拥有不同数量个边界框;因此,在达到m 之前,边界框少于 m 的图像将被非法边界框填充。 这样,每个边界框的标签将被长度为5的数组表示。 数组中的第一个元素是边界框中对象的类别,其中-1表示用于填充的非法边界框。 数组的其余四个元素是边界框左上角和右下角的(x,y)坐标值(值域在0~1之间)。 对于香蕉数据集而言,由于每张图像上只有一个边界框,因此 m = 1 m=1 m=1 。
-
%matplotlib inline import os import pandas as pd import torch import torchvision import requests import zipfile import hashlib DATA_HUB = dict() DATA_URL = 'http://d2l-data.s3-accelerate.amazonaws.com/' DATA_HUB['banana-detection'] = (DATA_URL + 'banana-detection.zip','5de26c8fce5ccdea9f91267273464dc968d20d72') def download(name, cache_dir=os.path.join('..', 'data')): """Download a file inserted into DATA_HUB, return the local filename. Defined in :numref:`sec_kaggle_house`""" assert name in DATA_HUB, f"{name} does not exist in {DATA_HUB}." url, sha1_hash = DATA_HUB[name] os.makedirs(cache_dir, exist_ok=True) fname = os.path.join(cache_dir, url.split('/')[-1]) if os.path.exists(fname): sha1 = hashlib.sha1() with open(fname, 'rb') as f: while True: data = f.read(1048576) if not data: break sha1.update(data) if sha1.hexdigest() == sha1_hash: return fname # Hit cache print(f'Downloading {fname} from {url}...') r = requests.get(url, stream=True, verify=True) with open(fname, 'wb') as f: f.write(r.content) return fname def download_extract(name, folder=None): """Download and extract a zip/tar file. Defined in :numref:`sec_kaggle_house`""" fname = download(name) base_dir = os.path.dirname(fname) data_dir, ext = os.path.splitext(fname) if ext == '.zip': fp = zipfile.ZipFile(fname, 'r') elif ext in ('.tar', '.gz'): fp = tarfile.open(fname, 'r') else: assert False, 'Only zip/tar files can be extracted.' fp.extractall(base_dir) return os.path.join(base_dir, folder) if folder else data_dir def read_data_bananas(is_train=True): """读取香蕉检测数据集中的图像和标签""" data_dir = download_extract('banana-detection') csv_fname = os.path.join(data_dir, 'bananas_train' if is_train else 'bananas_val', 'label.csv') csv_data = pd.read_csv(csv_fname) csv_data = csv_data.set_index('img_name') images, targets = [], [] for img_name, target in csv_data.iterrows(): images.append(torchvision.io.read_image( os.path.join(data_dir, 'bananas_train' if is_train else 'bananas_val', 'images', f'{img_name}'))) # 这里的target包含(类别,左上角x,左上角y,右下角x,右下角y), # 其中所有图像都具有相同的香蕉类(索引为0) targets.append(list(target)) return images, torch.tensor(targets).unsqueeze(1) / 256 class BananasDataset(torch.utils.data.Dataset): """一个用于加载香蕉检测数据集的自定义数据集""" def __init__(self, is_train): self.features, self.labels = read_data_bananas(is_train) print('read ' + str(len(self.features)) + (f' training examples' if is_train else f' validation examples')) def __getitem__(self, idx): return (self.features[idx].float(), self.labels[idx]) def __len__(self): return len(self.features) def load_data_bananas(batch_size): """加载香蕉检测数据集""" train_iter = torch.utils.data.DataLoader(BananasDataset(is_train=True), batch_size, shuffle=True) val_iter = torch.utils.data.DataLoader(BananasDataset(is_train=False),batch_size) return train_iter, val_iter batch_size, edge_size = 32, 256 train_iter, _ = load_data_bananas(batch_size) batch = next(iter(train_iter)) batch[0].shape, batch[1].shape -
read 1000 training examples read 100 validation examples (torch.Size([32, 3, 256, 256]), torch.Size([32, 1, 5])) -
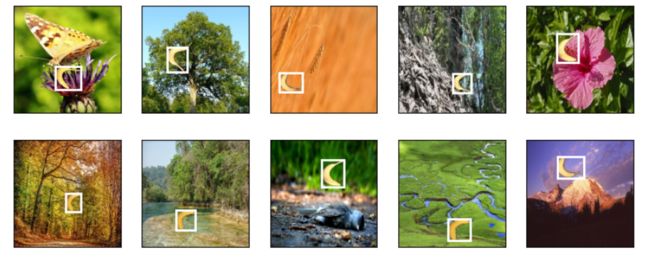
让我们展示10幅带有真实边界框的图像。 我们可以看到在所有这些图像中香蕉的旋转角度、大小和位置都有所不同。 当然,这只是一个简单的人工数据集,实践中真实世界的数据集通常要复杂得多。
-
import matplotlib.pyplot as plt import numpy def bbox_to_rect(bbox, color): """Convert bounding box to matplotlib format. Defined in :numref:`sec_bbox`""" # Convert the bounding box (upper-left x, upper-left y, lower-right x, # lower-right y) format to the matplotlib format: ((upper-left x, # upper-left y), width, height) return plt.Rectangle( xy=(bbox[0], bbox[1]), width=bbox[2]-bbox[0], height=bbox[3]-bbox[1], fill=False, edgecolor=color, linewidth=2) def show_images(imgs, num_rows, num_cols, titles=None, scale=1.5): """Plot a list of images. Defined in :numref:`sec_fashion_mnist`""" figsize = (num_cols * scale, num_rows * scale) _, axes = plt.subplots(num_rows, num_cols, figsize=figsize) axes = axes.flatten() for i, (ax, img) in enumerate(zip(axes, imgs)): if torch.is_tensor(img): # Tensor Image ax.imshow(img.numpy()) else: # PIL Image ax.imshow(img) ax.axes.get_xaxis().set_visible(False) ax.axes.get_yaxis().set_visible(False) if titles: ax.set_title(titles[i]) return axes def show_bboxes(axes, bboxes, labels=None, colors=None): """Show bounding boxes. Defined in :numref:`sec_anchor`""" def make_list(obj, default_values=None): if obj is None: obj = default_values elif not isinstance(obj, (list, tuple)): obj = [obj] return obj labels = make_list(labels) colors = make_list(colors, ['b', 'g', 'r', 'm', 'c']) for i, bbox in enumerate(bboxes): color = colors[i % len(colors)] rect = bbox_to_rect(bbox, color) axes.add_patch(rect) if labels and len(labels) > i: text_color = 'k' if color == 'w' else 'w' axes.text(rect.xy[0], rect.xy[1], labels[i], va='center', ha='center', fontsize=9, color=text_color, bbox=dict(facecolor=color, lw=0)) imgs = (batch[0][0:10].permute(0, 2, 3, 1)) / 255 axes = show_images(imgs, 2, 5, scale=2) for ax, label in zip(axes, batch[1][0:10]): show_bboxes(ax, [label[0][1:5] * edge_size], colors=['w']) -
李沐老师团队收集的香蕉检测数据集可用于演示目标检测模型。用于目标检测的数据加载与图像分类的数据加载类似。但是,在目标检测中,标签还包含真实边界框的信息,它不出现在图像分类中。


