特征类型和图像分割(Types of Features & Image Segmentation)计算机视觉
前言:对于任何一个物体,其组成部分大概可以用三大类表示:边缘、角点和斑点
- 边缘(edges): Areas with a high intensity gradient . 分布在梯度强度区域
- 角点(corners): At the intersection of two edges. 两个边缘的角点
- 斑点(blocks): Region-based features; areas of extreme brightness or unique texture .
其中,角点是重复率最高的,也是应用比较广泛的
1、Corners detection(角点检测)
由于本文中用到的角点检测函数是OpenCV集成的函数Harris Corner Detection,所以想要查看此函数的详细内容的请点击这里Harris Corner Detection
(1)、首先简单的介绍一下进行角点检测的一般性步骤
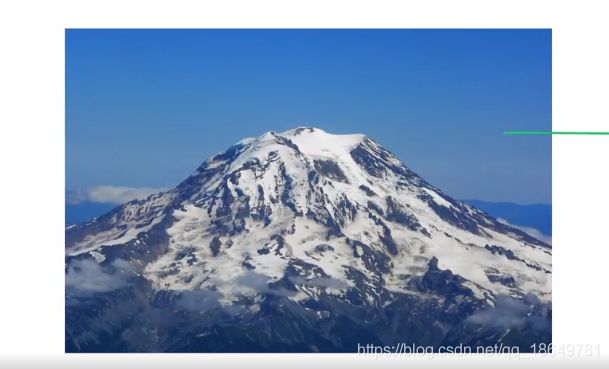
- 首先对两幅图进行Sobel边缘检测,因为角点是两条边缘的交点,所以若想进行角点检测,首先需要进行边缘检测,如下图所示对,注意在这里相较于进行边缘检测,没有进行二值化处理,只是进行Sobel_X和Sobel_Y的变换。
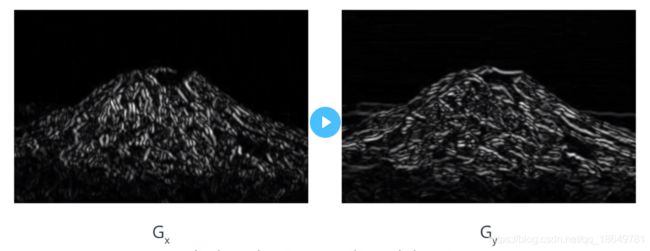
- 接下来将XY坐标系下的像素分布,转换成极坐标的像素分布;具体的转换公式见下面两个公式:
Magnitude:
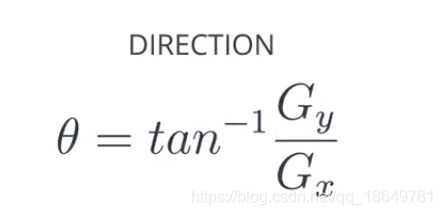
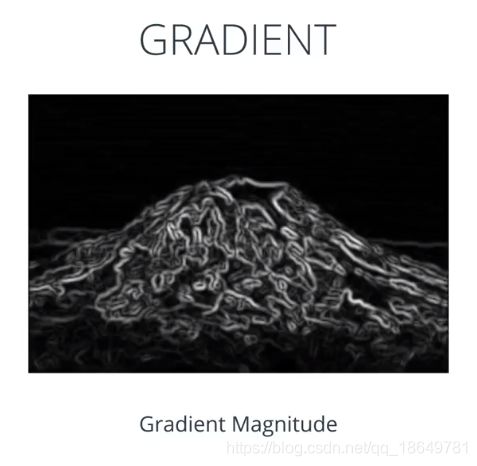
经过上面两个公式的转化,实际上是将Sobel_x和Sobel_y两个分梯度图合称了一个总的梯度图,为接下来的操作做准备,类似于下面这幅图
- 接下来进行两个操作
(1)、Shift a window around an area in an image.
(2)、Check for a big variation in the direction and magnitude of the gradient.
(2)、角点检测函数 Harris Corner Detection 的使用
函数原型: dst = cv2.cornerHarris( gray, blockSize, ksize, k )
具体参数的解释:
	1、第一个参数:gray: input image,it should be grayscale and float32 type .
	2、第二个参数:blockSize : It is the size of neighbourhood considered for corner detection
	3、第三个参数: ksize:Aperture parameter for Sobel derivative used.(Sobel算子矩阵的大小)
	4、第四个参数:k :Harris detector free parameter in the equation.(用来确定哪些点将被视为角点 ,通常设置为0.04,如果设置的越小,检测到的角点就越多,设置的越大,检测到的角点的个数就越少)
Example
dst = cv2.cornerHarris(gray,2,3,0.04)
在这里:
 第一个参数是:转换过后的灰度图
 第二个参数是:检测角点时的核大小,在这里定义的是 2x2的一个矩形像素区域
 第三个参数是:进行Sobel算子检测的算子矩阵大小,在这里是 3X3
 第四个参数是: 用来确定哪些点将被视为角点 ,通常设置为0.04.
(3)、进行角点检测的源码
import matplotlib.pyplot as plt
import numpy as np
import cv2

%matplotlib inline

# Read in the image
image = cv2.imread('images/waffle.jpg')  ## 注意:此处图片的路径和代码在同一个文件夹下,所以就不用加前面具体所在的路径

# Make a copy of the image
image_copy = np.copy(image)

# Change color to RGB (from BGR)
image_copy = cv2.cvtColor(image_copy, cv2.COLOR_BGR2RGB)

plt.imshow(image_copy)
# Convert to grayscale
gray = cv2.cvtColor(image_copy, cv2.COLOR_RGB2GRAY)
gray = np.float32(gray)  ## 在这里将值转化为浮点型,

# Detect corners
dst = cv2.cornerHarris(gray, 2, 3, 0.04)  ###注意在这里需要输入的参数:第一个是 灰度图浮点值, 第二个参数是方块的大小,第三个参数是sobel算子的大小
### 第四个参数,用来确定哪些是角点,通常在这里设置为0.04


# Dilate corner image to enhance corner points
dst = cv2.dilate(dst,None)    ## 这一步叫做“角点膨胀”膨胀会放大明亮的区域

plt.imshow(dst, cmap='gray')

## TODO: Define a threshold for extracting strong corners
# This value vary depending on the image and how many corners you want to detect
# Try changing this free parameter, 0.1, to be larger or smaller ans see what happens
thresh = 0.1*dst.max()

# Create an image copy to draw corners on
corner_image = np.copy(image_copy)

# Iterate through all the corners and draw them on the image (if they pass the threshold)
for j in range(0, dst.shape[0]):
    for i in range(0, dst.shape[1]):
        if(dst[j,i] > thresh):
            # image, center pt, radius, color, thickness
            cv2.circle( corner_image, (i, j), 1, (0,255,0), 1) ## 用绿色来标记检测出来的角点

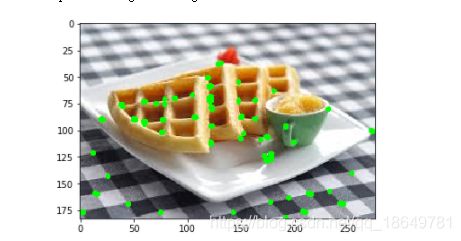
plt.imshow(corner_image)
(4)、下图为进行角点检测的运行结果
2、Finding Contours (进行边缘检测)
(1) 关于轮廓边缘检测的概述
- continuous curves that fellow the edges along a boundary , provide a lot of information about the shape of an object boundary.
- 对边界进行检测是非常有必要的,
- 在OpenCV 里,如果物体时白色的,背景时黑色的,那就可以得到最好的轮廓检测效果,所以在识别图像轮廓之前,我们要先为图像创建二进制阈值,这样才能用黑白像素将图像里不同的物体区分开来,然后我们用这些物体的边缘来形成轮廓,这种二值图像通常只由一个阈值生成
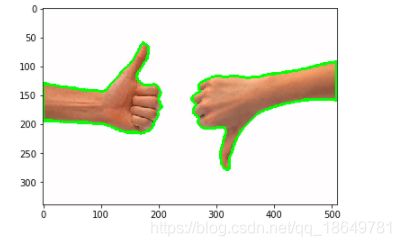
- 手部识别是计算机视觉如今面临的一个挑战,该应用十分实用,例如,进行手势的识别,接下来以手的图片进行外围轮廓的构建。
(2) 具体的代码
import numpy as np
import matplotlib.pyplot as plt
import cv2

%matplotlib inline

# Read in the image
image = cv2.imread('images/thumbs_up_down.jpg')

# Change color to RGB (from BGR)
image = cv2.cvtColor(image, cv2.COLOR_BGR2RGB)

plt.imshow(image)
# Convert to grayscale
gray = cv2.cvtColor(image,cv2.COLOR_RGB2GRAY)

# Create a binary thresholded image
retval, binary = cv2.threshold(gray, 225, 255, cv2.THRESH_BINARY_INV)  ## 然后用逆二进制阈值,把手显示为白色

plt.imshow(binary, cmap='gray')

# Find contours from thresholded, binary image  ## OpenCV 函数
retval, contours, hierarchy = cv2.findContours(binary, cv2.RETR_TREE, cv2.CHAIN_APPROX_SIMPLE)

# Draw all contours on a copy of the original image
contours_image = np.copy(image)
contours_image = cv2.drawContours(contours_image, contours, -1, (0,255,0), 3)

plt.imshow(contours_image)
(2) 效果图
3、K-means (k均值聚类算法)
(1)、OpenCV中 kmeans函数的简单介绍
函数原型: cv2.kmeans( )
具体的输入输出参数以及含义:
 1. samples : It should be of np.float32 data type, and each feature should be put in a single column.
 2. nclusters(K) : Number of clusters required at end
 3. criteria : It is the iteration termination criteria. When this criteria is satisfied, algorithm iteration stops. Actually, it should be a tuple of 3 parameters. They are ( type, max_iter, epsilon ):
 4. attempts : Flag to specify the number of times the algorithm is executed using different initial labellings. The algorithm returns the labels that yield the best compactness. This compactness is returned as output.
 5. flags : This flag is used to specify how initial centers are taken. Normally two flags are used for this : cv2.KMEANS_PP_CENTERS and cv2.KMEANS_RANDOM_CENTERS.
(2)、上述函数应用的源码
import numpy as np
import matplotlib.pyplot as plt
import cv2

%matplotlib inline

# Read in the image
## TODO: Check out the images directory to see other images you can work with
# And select one!
image = cv2.imread('images/monarch.jpg')

# Change color to RGB (from BGR)
image = cv2.cvtColor(image, cv2.COLOR_BGR2RGB)

plt.imshow(image)
# Reshape image into a 2D array of pixels and 3 color values (RGB)
## 使其变成一个二维数组,以便输入K均值算法
pixel_vals = image.reshape((-1,3))  ## 这里注意一下,-1是指不知道行数,3是分成三列

# Convert to float type
pixel_vals = np.float32(pixel_vals) ## kmeans 函数的要求,需要转换城32位的才能进行下面运算
# define stopping criteria
# you can change the number of max iterations for faster convergence!
criteria = (cv2.TERM_CRITERIA_EPS + cv2.TERM_CRITERIA_MAX_ITER, 100, 0.2) ##这是迭代终止条件,这里我要用 ε 值或迭代最## 大次数来定义标准,迭代最大次数设为 10 而 ε 这个值我们曾略略提过,也就是在经过几次迭代后 若簇移动的范围小于该值,则算法终止,实现了收敛。

## TODO: Select a value for k
# then perform k-means clustering
k = 3
retval, labels, centers = cv2.kmeans(pixel_vals, k, None, criteria, 10, cv2.KMEANS_RANDOM_CENTERS)

# convert data into 8-bit values
centers = np.uint8(centers)  ## 为了显示图片,需要将图片变成8bit的类型
segmented_data = centers[labels.flatten()]  ## 这一句表示的含义是:重塑分割好的数据,使其变回图像副本原本的形状

# reshape data into the original image dimensions   现在就能跟绘制其它图像一样将分割好的图像绘制出来了
segmented_image = segmented_data.reshape((image.shape))
labels_reshape = labels.reshape(image.shape[0], image.shape[1])

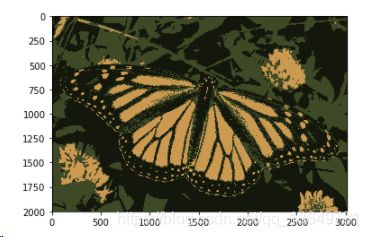
plt.imshow(segmented_image)
## TODO: Visualize one segment, try to find which is the leaves, background, etc!
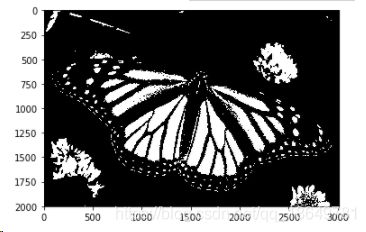
plt.imshow(labels_reshape==0, cmap='gray')
# mask an image segment by cluster

cluster = 0 # the first cluster

masked_image = np.copy(image)
# turn the mask green!
masked_image[labels_reshape == cluster] = [0, 255, 0]

plt.imshow(masked_image)
