AI制药 - RCSB PDB 数据集的多维度分析与整理 (1)
欢迎关注我的CSDN:https://spike.blog.csdn.net/
本文地址:https://blog.csdn.net/caroline_wendy/article/details/130089781
整体:
RCSB PDB 数据集是一个收集了蛋白质的三维结构信息的数据库,是世界蛋白质数据库(wwPDB)的成员之一,也是生物学和医学领域第一个开放访问的数字数据资源库。RCSB PDB 数据集不仅提供了来自蛋白质数据银行(PDB)档案的实验确定的3D结构,还提供了来自 AlphaFold DB 和 ModelArchive 的计算结构模型(CSM)。用户可以利用 RCSB PDB 数据集提供的各种工具和资源,根据序列、结构和功能的注释进行简单和高级搜索,可视化、下载和分析这些分子,并且在外部注释的背景下,探索生物学的结构视角 。
关于 Complex 和 Multimer 的差别:
组合在一起形成功能性基团的复合物,通常会叫Complex,比如Antibody-antigen Complex 或 Ligand-receptor Complex;Multimer通常指堆在一起的非单体情况,不一定有真正的结合或可以发挥功能,只是结构上在一起,比如aggregation发生时,通常会提到Monomer/Multimer。总体,Multimer在生物学上用的不多。以上我的理解和习惯,也可能不同的文章中会有人混用,尤其是非母语文章,也不能算是错误。
RCSB:Research Collaboratory for Structural Bioinformatics,即结构生物信息学的研究合作实验室。
- 官网:https://www.pdbus.org/
- 目前,已经有 202,467 (2023.3.21) 个PDB结构。
- Vision:To expand the frontiers of fundamental biology, biomedicine, energy sciences, and biotechnology through open and sustainable access to the 3D structure, function, and evolution of biological macromolecules contained in the Protein Data Bank (PDB) archive.
- 愿景:扩展基础生物学、生物医学、能源科学和生物技术的前沿方向,通过开放的和可持续的访问 PDB 档案中所包括的生物大分子的 3D 结构、功能和进化。
1. RCSB PDB
PDB全量数据:最后更新日期 2022.4.13
- 全量链数:593491,约59万
- 全量PDB数:183653个PDB结构,实际包括182703个,略有差异,相差950个,约18万
标签如下:
id:行号,从0开始pdb:PDB编号,例如 3eo1resolution:分辨率,例如 3.1release_date:发布日期,例如 2008-12-02seq:序列,例如 ETVLTQSPGT…len:序列长度,例如 215chain_type:链的类型,例如 k是kappa型轻链,l是lamdabcr_or_tcr:BCR或TCR或none
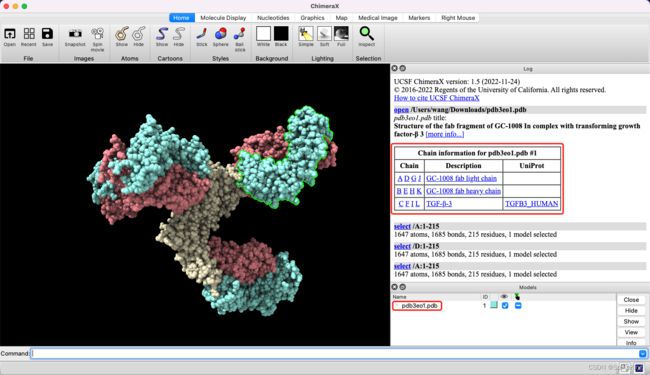
第1个示例,PDB 3eo1,包括0-11,一共12行,即12个链。具体数据如下:
bid,pdb,chain,resolution,release_date,seq,len,chain_type,bcr_or_tcr
0,3eo1,A,3.1,2008-12-02,ETVLTQSPGTLSLSPGERATLSCRASQSLGSSYLAWYQQKPGQAPRLLIYGASSRAPGIPDRFSGSGSGTDFTLTISRLEPEDFAVYYCQQYADSPITFGQGTRLEIKRTVAAPSVFIFPPSDEQLKSGTASVVCLLNNFYPREAKVQWKVDNALQSGNSQESVTEQDSKDSTYSLSSTLTLSKADYEKHKVYACEVTHQGLSSPVTKSFNRGEC,215,k,BCR
1,3eo1,B,3.1,2008-12-02,QVQLVQSGAEVKKPGSSVKVSCKASGYTFSSNVISWVRQAPGQGLEWMGGVIPIVDIANYAQRFKGRVTITADESTSTTYMELSSLRSEDTAVYYCASTLGLVLDAMDYWGQGTLVTVSSASTKGPSVFPLAPCSESTAALGCLVKDYFPEPVTVSWNSGALTSGVHTFPAVLQSSGLYSLSSVVTVPSSSLGTKTYTCNVDHKPSNTKVDKRVES,216,h,BCR
2,3eo1,C,3.1,2008-12-02,ALDTNYCFRNLEENCCVRPLYIDFRQDLGWKWVHEPKGYYANFCSGPCPYLRSADTTHSTVLGLYNTLNPEASASPCCVPQDLEPLTILYYVGRTPKVEQLSNMVVKSCKCS,112,protein,none
3,3eo1,D,3.1,2008-12-02,ETVLTQSPGTLSLSPGERATLSCRASQSLGSSYLAWYQQKPGQAPRLLIYGASSRAPGIPDRFSGSGSGTDFTLTISRLEPEDFAVYYCQQYADSPITFGQGTRLEIKRTVAAPSVFIFPPSDEQLKSGTASVVCLLNNFYPREAKVQWKVDNALQSGNSQESVTEQDSKDSTYSLSSTLTLSKADYEKHKVYACEVTHQGLSSPVTKSFNRGEC,215,k,BCR
4,3eo1,E,3.1,2008-12-02,QVQLVQSGAEVKKPGSSVKVSCKASGYTFSSNVISWVRQAPGQGLEWMGGVIPIVDIANYAQRFKGRVTITADESTSTTYMELSSLRSEDTAVYYCASTLGLVLDAMDYWGQGTLVTVSSASTKGPSVFPLAPCSESTAALGCLVKDYFPEPVTVSWNSGALTSGVHTFPAVLQSSGLYSLSSVVTVPSSSLGTKTYTCNVDHKPSNTKVDKRVES,216,h,BCR
5,3eo1,F,3.1,2008-12-02,ALDTNYCFRNLEENCCVRPLYIDFRQDLGWKWVHEPKGYYANFCSGPCPYLRSADTTHSTVLGLYNTLNPEASASPCCVPQDLEPLTILYYVGRTPKVEQLSNMVVKSCKCS,112,protein,none
6,3eo1,G,3.1,2008-12-02,ETVLTQSPGTLSLSPGERATLSCRASQSLGSSYLAWYQQKPGQAPRLLIYGASSRAPGIPDRFSGSGSGTDFTLTISRLEPEDFAVYYCQQYADSPITFGQGTRLEIKRTVAAPSVFIFPPSDEQLKSGTASVVCLLNNFYPREAKVQWKVDNALQSGNSQESVTEQDSKDSTYSLSSTLTLSKADYEKHKVYACEVTHQGLSSPVTKSFNRGEC,215,k,BCR
7,3eo1,H,3.1,2008-12-02,QVQLVQSGAEVKKPGSSVKVSCKASGYTFSSNVISWVRQAPGQGLEWMGGVIPIVDIANYAQRFKGRVTITADESTSTTYMELSSLRSEDTAVYYCASTLGLVLDAMDYWGQGTLVTVSSASTKGPSVFPLAPCSESTAALGCLVKDYFPEPVTVSWNSGALTSGVHTFPAVLQSSGLYSLSSVVTVPSSSLGTKTYTCNVDHKPSNTKVDKRVES,216,h,BCR
8,3eo1,I,3.1,2008-12-02,ALDTNYCFRNLEENCCVRPLYIDFRQDLGWKWVHEPKGYYANFCSGPCPYLRSADTTHSTVLGLYNTLNPEASASPCCVPQDLEPLTILYYVGRTPKVEQLSNMVVKSCKCS,112,protein,none
9,3eo1,J,3.1,2008-12-02,ETVLTQSPGTLSLSPGERATLSCRASQSLGSSYLAWYQQKPGQAPRLLIYGASSRAPGIPDRFSGSGSGTDFTLTISRLEPEDFAVYYCQQYADSPITFGQGTRLEIKRTVAAPSVFIFPPSDEQLKSGTASVVCLLNNFYPREAKVQWKVDNALQSGNSQESVTEQDSKDSTYSLSSTLTLSKADYEKHKVYACEVTHQGLSSPVTKSFNRGEC,215,k,BCR
10,3eo1,K,3.1,2008-12-02,QVQLVQSGAEVKKPGSSVKVSCKASGYTFSSNVISWVRQAPGQGLEWMGGVIPIVDIANYAQRFKGRVTITADESTSTTYMELSSLRSEDTAVYYCASTLGLVLDAMDYWGQGTLVTVSSASTKGPSVFPLAPCSESTAALGCLVKDYFPEPVTVSWNSGALTSGVHTFPAVLQSSGLYSLSSVVTVPSSSLGTKTYTCNVDHKPSNTKVDKRVES,216,h,BCR
11,3eo1,L,3.1,2008-12-02,ALDTNYCFRNLEENCCVRPLYIDFRQDLGWKWVHEPKGYYANFCSGPCPYLRSADTTHSTVLGLYNTLNPEASASPCCVPQDLEPLTILYYVGRTPKVEQLSNMVVKSCKCS,112,protein,none
PDB提取的FASTA文件与标签文件一致,例如3EO1 PDB:
2. Resolution
Resolution Range: 0.48 ~ 70.0
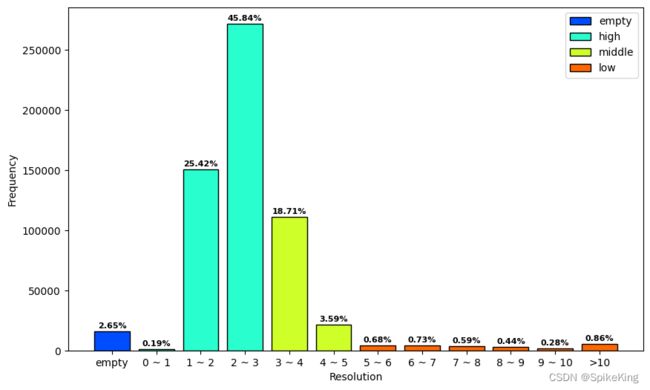
Resolution (chain-level):
- bins: [15729,1119,150876,272060,111062,21324,4037,4357,3500,2636,6791], sum: 593491
- Empty: 15729, 2.65%
- High(0~3): 1119+150876+272060 = 424055, 71.45%
- Middle(3~5): 111062+21324 = 132386, 22.31%
- Low(>5): 4037+4357+3500+2636+6791 = 21321, 3.59%
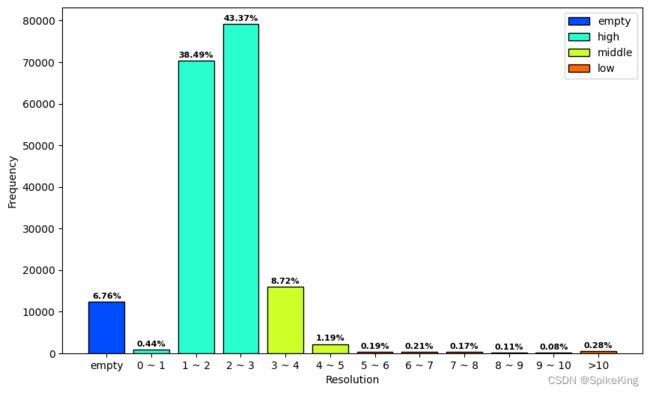
Resolution (PDB-level):
- bins: [12347,810,70325,79230,15929,2179,346,375,307,197,658], sum: 182703
- Empty: 12347, 6.76%
- High(0~3): 810+70325+79230 = 150365, 82.30%
- Middle(3~5): 15929+2179 = 18108, 9.91%
- Low(>5): 346+375+307+197+658 = 1883, 1.03%
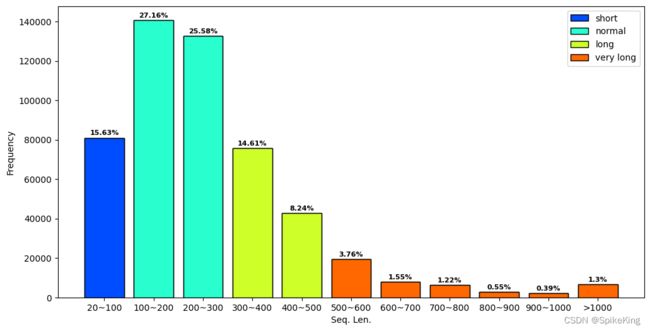
3. Seq. Len.
链长分布:0 ~ 4433。
异常数据,链长是0,包括38447个,数据如下:
id   pdb chain  resolution release_date  seq  len chain_type bcr_or_tcr
19  6dts     C         1.5   2018-09-19  NaN    0    protein       none
20  6dts     D         1.5   2018-09-19  NaN    0    protein       none
69  6v8x     M         3.0   2020-02-05  NaN    0    protein       none
70  6v8x     N         3.0   2020-02-05  NaN    0    protein       none
71  6v8x     O         3.0   2020-02-05  NaN    0    protein       none
数据分布:
- 标签 0: 81019, 100: 140791, 200: 132580, 300: 75717, 400: 42730, 500: 19507, 600: 8027, 700: 6335, 800: 2849, 900: 2017, 1000: 6730
- len >= 20, 518302, 87.33%;len < 20, 75189, 12.66%
- Short(20~100): 81019, 15.63%
- Normal(100~300): 140791+132580 = 273371, 52.75%
- Long(300~500): 75717+42730 = 118447, 22.85%
- Very Long(>500): 19507+8027+6335+2849+2017+6730 = 45465, 8.77%
蛋白质的链长大于20
蛋白质至少包含一个长多肽。短多肽,含有少于20-30个残基,很少被认为是蛋白质,通常被称为肽。
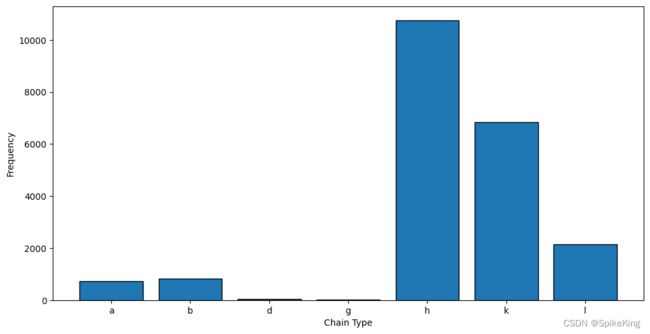
4. Antibody
chain_type: [‘k’ ‘h’ ‘protein’ ‘l’ ‘a’ ‘b’ ‘d’ ‘g’]
- 其中,k和l是轻链,protein是抗原或其他蛋白质
- a\b\d\g是TCR的链
- a: 721, b: 824, d: 54, g: 28, h: 10762, k: 6831, l: 2143, protein: 572128
- Percentage of DB: 21363/593491 = 3.60%
- BCR (19736);TCR (1627)
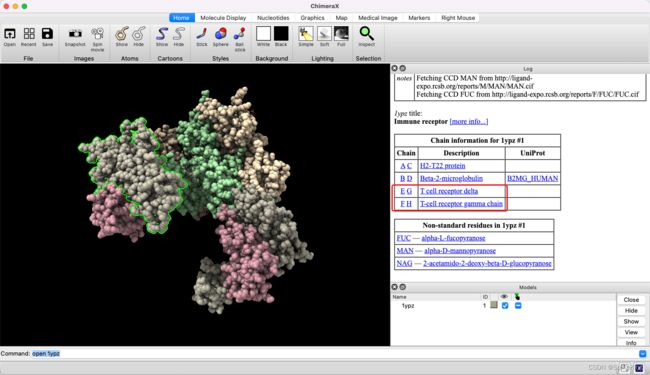
lypz 实例如下:
- g:F和H是 T cell Receptor Gamma Chain,T细胞受体 γ \gamma γ链
- d:E和G是 T cell Receptor Delta,T细胞受体 δ \delta δ链
标签:
22355       22355  1ypz     A         3.4   2005-04-12  GSHSLRYFYTAVSRPGLGEPWFIIVGYVDDMQVLRFSSKEETPRMA...  260    protein       none
22356       22356  1ypz     B         3.4   2005-04-12  ADPIQRTPKIQVYSRHPAENGKSNFLNCYVSGFHPSDIEVDLLKNG...  102    protein       none
22357       22357  1ypz     C         3.4   2005-04-12  GSHSLRYFYTAVSRPGLGEPWFIIVGYVDDMQVLRFSSKEETPRMA...  260    protein       none
22358       22358  1ypz     D         3.4   2005-04-12  ADPIQRTPKIQVYSRHPAENGKSNFLNCYVSGFHPSDIEVDLLKNG...  102    protein       none
22359       22359  1ypz     E         3.4   2005-04-12  GDQVEQSPSALSLHEGTDSALRCNFTTTMRSVQWFRQNSRGSLISL...  207          d        TCR
22360       22360  1ypz     F         3.4   2005-04-12  HGKLEQPEISISRPRDETAQISCKVFIESFRSVTIHWYRQKPNQGL...  230          g        TCR
22361       22361  1ypz     G         3.4   2005-04-12  GDQVEQSPSALSLHEGTDSALRCNFTTTMRSVQWFRQNSRGSLISL...  207          d        TCR
22362       22362  1ypz     H         3.4   2005-04-12  HGKLEQPEISISRPRDETAQISCKVFIESFRSVTIHWYRQKPNQGL...  230          g        TCR
22363       22363  1ypz     I         3.4   2005-04-12                                                NaN    0    protein       none
22364       22364  1ypz     J         3.4   2005-04-12                                                NaN    0    protein       none
22365       22365  1ypz     K         3.4   2005-04-12                                                NaN    0    protein       none
22366       22366  1ypz     L         3.4   2005-04-12                                                NaN    0    protein       none
22367       22367  1ypz     M         3.4   2005-04-12                                                NaN    0    protein       none
LYPZ PDB结构:
Chain Type 数据分布:
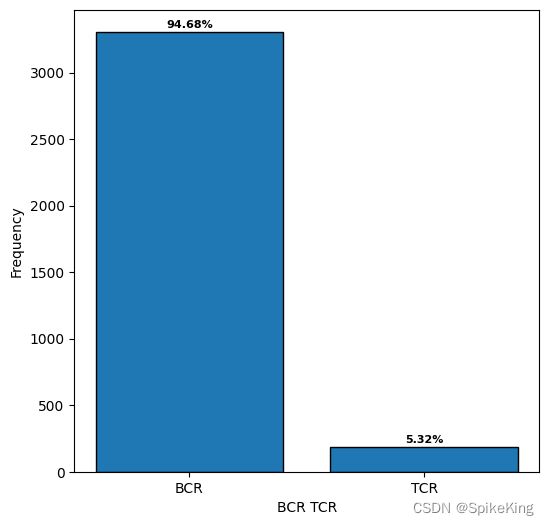
BCR or TCR:
- bcr or tcr type: [‘none’ ‘BCR’ ‘TCR’]
- BCR: 3308, TCR: 186, none: 179209
- Percentage of DB: 3494/182703 = 1.91%
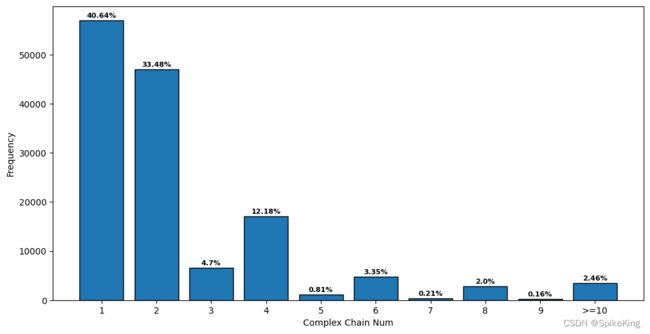
5. Complex / Multimer
Chain 清洗前593491,清洗后357216;PDB 清洗前182703,清洗后140320。清洗方法:
df = df.loc[df['len'] >= 20]
df = df.loc[df['len'] <= 500]
df = df.loc[df["resolution"].fillna(-1).astype(int) > 0]
df = df.loc[df["resolution"] <= 3]
具体分析:
- complex chain range: 1 ~ 55
- clean pdb (357216):20 <= seq len <=500;resolution <= 3
- 链长范围:1: 57033, 2: 46973, 3: 6594, 4: 17094, 5: 1141, 6: 4703, 7: 301, 8: 2801, 9: 224, 10: 3456, sum: 140320
- Monomer: 57033, 40.64%
- Multimer(2~4): 46973+6594+17094 = 70661, 50.35%
- Multimer(>=5): 1141+4703+301+2801+224+3456 = 12626, 9.00%
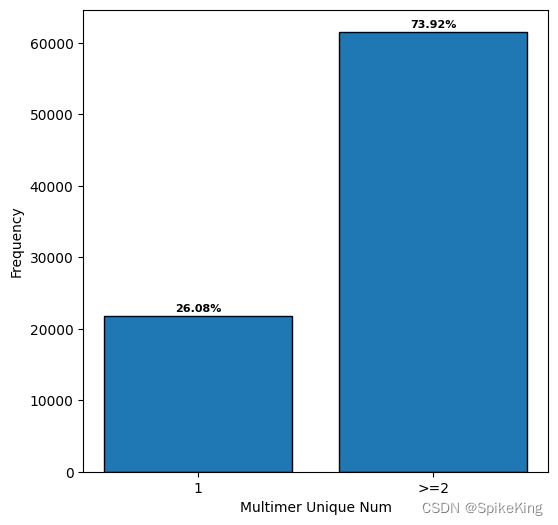
在全部的复合物 (83287) 中,包括同源多聚体和异源多聚体:
- Homo Multimer: 21721, 26.08%
- Hetero Multimer: 83287, 73.92%
6. 参考
- Stack Overfolw - Convert floats to ints in Pandas?
- Stack Overfolw - histogram: setting y-axis label for pandas
- Stack Overfolw - Matplotlib histogram with multiple legend entries
- PDB - Resolution
- Pandas: How to Combine Rows with Same Column Values
- Stack Overflow - Selecting multiple columns in a Pandas dataframe
- Stack Overflow - How to center labels in histogram plot
- Control the color of barplots built with matplotlib
- Display percentage above bar chart in Matplotlib
- Stack Overflow - Get statistics for each group (such as count, mean, etc) using pandas GroupBy?
- Stack Overflow - How to get unique values from multiple columns in a pandas groupby
- Pandas Groupby – Count of rows in each group
7. 源码
#!/usr/bin/env python
# -- coding: utf-8 --
"""
Copyright (c) 2022. All rights reserved.
Created by C. L. Wang on 2023/4/10
"""

import os
import sys
from time import time

import numpy as np
import pandas as pd
from matplotlib import pyplot as plt
from matplotlib.patches import Rectangle

p = os.path.dirname(os.path.dirname(os.path.abspath(__file__)))
if p not in sys.path:
    sys.path.append(p)

from myutils.project_utils import traverse_dir_files, write_list_to_file, mkdir_if_not_exist
from root_dir import DATA_DIR


class RcsbProcessor(object):
    """
    RCSB数据集分析
    """
    def __init__(self):
        self.rcsb_dir = os.path.join(DATA_DIR, "rcsb")
        mkdir_if_not_exist(self.rcsb_dir)

        # 输入
        self.rcsb_full_dir = "[PDB文件夹]"
        self.profiling_protein_path = os.path.join(self.rcsb_dir, "profiling_protein_593491.csv")

        # 输出
        rcsb_full_prefix = "rcsb_pdb_all"
        self.rcsb_all_pdb_format = os.path.join(self.rcsb_dir, f"{rcsb_full_prefix}" + "_{}.txt")

        # 读取PDB
        paths_list = traverse_dir_files(self.rcsb_dir)
        is_traverse = False
        for path in paths_list:
            base_name = os.path.basename(path)
            if rcsb_full_prefix in base_name:
                is_traverse = True
        if not is_traverse:
            self.init_full_paths()  # 初始化全部路径
        else:
            print("[Info] 已经初始化完成PDB全部路径!")

    def init_full_paths(self):
        print(f"[Info] 初始化路径开始!")
        s_time = time()
        print(f"[Info] 数据集路径: {self.rcsb_full_dir}")
        paths_list = traverse_dir_files(self.rcsb_full_dir)
        rcsb_all_pdb_path = self.rcsb_all_pdb_format.format(len(paths_list))
        print(f"[Info] 输出路径: {self.rcsb_full_dir}")
        write_list_to_file(rcsb_all_pdb_path, paths_list)
        print(f"[Info] 写入完成! {rcsb_all_pdb_path}, 耗时: {time()-s_time}")

    @staticmethod
    def draw_resolution(data_list, save_path):
        """
        绘制分辨率,分辨率的范围是-1到10,划分11个bin
        其中,-1是empty、[1,2,3]是high、其余是low
        :param data_list:   数据列表
        :param save_path:   存储路径
        :return:  绘制图像
        """
        labels, counts = np.unique(np.array(data_list), return_counts=True)

        labels_str = []
        for vl in labels:
            if vl == -1:
                label = "empty"
            else:
                label = f"{vl} ~ {vl+1}"
            labels_str.append(label)
        labels_str.pop(-1)
        labels_str.append(f">{labels[-1]}")

        # 颜色设置
        cmap = plt.get_cmap('jet')
        empty, high, middle, low = cmap(0.2), cmap(0.4), cmap(0.6), cmap(0.8)
        color = [empty, high, high, high, middle, middle, low, low, low, low, low, low]
        graph = plt.bar(labels_str, counts, align='center', color=color, edgecolor='black')
        plt.gca().set_xticks(labels_str)

        handles = [Rectangle((0, 0), 1, 1, color=c, ec="k") for c in [empty, high, middle, low]]
        color_labels = ["empty", "high", "middle", "low"]
        plt.legend(handles, color_labels)

        # 绘制百分比
        count_sum = sum(counts)
        percentage_list = []
        for count in counts:
            pct = (count / count_sum) * 100
            percentage_list.append(round(pct, 2))
        i = 0
        max_height = max([p.get_height() for p in graph])
        for p in graph:
            width = p.get_width()
            height = p.get_height()
            x, y = p.get_xy()
            plt.text(x + width / 2,
                     y + height + max_height*0.01,
                     str(percentage_list[i]) + '%',
                     size=8,
                     ha='center',
                     weight='bold')
            i += 1

        # label设置
        plt.xlabel("Resolution")
        plt.ylabel("Frequency")

        # 尺寸以及存储
        fig = plt.gcf()
        fig.set_size_inches(10, 6)
        if save_path:
            plt.savefig(save_path, bbox_inches='tight', pad_inches=0.1)
        else:
            plt.show()
        plt.close()

    @staticmethod
    def draw_seq_len(data_list, save_path=None):
        """
        绘制序列长度的分布
        :param data_list: 序列数据集
        :param save_path: 图像存储
        :return: None
        """
        labels, counts = np.unique(np.array(data_list), return_counts=True)
        labels_str = []
        for vl in labels:
            if vl == -1:
                label = "empty"
            else:
                label = f"{vl}~{vl+100}"
            labels_str.append(label)
        labels_str[-1] = f">{labels[-1]}"
        labels_str[0] = f"20~100"

        counts = list(counts)
        graph = plt.bar(labels_str, counts, align='center', edgecolor='black')
        plt.gca().set_xticks(labels_str)

        # label设置
        plt.xlabel("Seq. Len.")
        plt.ylabel("Frequency")

        # 颜色设置
        cmap = plt.get_cmap('jet')
        short, normal, long, v_long = cmap(0.2), cmap(0.4), cmap(0.6), cmap(0.8)
        color = [short, normal, normal, long, long, v_long, v_long, v_long, v_long, v_long, v_long]
        graph = plt.bar(labels_str, counts, align='center', color=color, edgecolor='black')
        plt.gca().set_xticks(labels_str)

        handles = [Rectangle((0, 0), 1, 1, color=c, ec="k") for c in [short, normal, long, v_long]]
        color_labels = ["short", "normal", "long", "very long"]
        plt.legend(handles, color_labels)

        # 绘制百分比
        count_sum = sum(counts)
        percentage_list = []
        for count in counts:
            pct = (count / count_sum) * 100
            percentage_list.append(round(pct, 2))
        i = 0
        max_height = max([p.get_height() for p in graph])
        for p in graph:
            width = p.get_width()
            height = p.get_height()
            x, y = p.get_xy()
            plt.text(x + width / 2,
                     y + height + max_height*0.01,
                     str(percentage_list[i]) + '%',
                     size=8,
                     ha='center',
                     weight='bold')
            i += 1

        # 尺寸以及存储
        fig = plt.gcf()
        fig.set_size_inches(12, 6)
        if save_path:
            plt.savefig(save_path, bbox_inches='tight', pad_inches=0.1)
        else:
            plt.show()
        plt.close()

    @staticmethod
    def draw_chain_type(data_list, save_path=None):
        labels, counts = np.unique(np.array(data_list), return_counts=True)
        graph = plt.bar(labels, counts, align='center', edgecolor='black')

        # label设置
        plt.xlabel("Chain Type")
        plt.ylabel("Frequency")
        plt.gca().set_xticks(labels)

        # 绘制百分比
        count_sum = sum(counts)
        percentage_list = []
        for count in counts:
            pct = (count / count_sum) * 100
            percentage_list.append(round(pct, 2))
        i = 0
        max_height = max([p.get_height() for p in graph])
        for p in graph:
            width = p.get_width()
            height = p.get_height()
            x, y = p.get_xy()
            plt.text(x + width / 2,
                     y + height + max_height*0.01,
                     str(percentage_list[i]) + '%',
                     size=8,
                     ha='center',
                     weight='bold')
            i += 1

        # 尺寸以及存储
        fig = plt.gcf()
        fig.set_size_inches(12, 6)
        if save_path:
            plt.savefig(save_path, bbox_inches='tight', pad_inches=0.1)
        else:
            plt.show()
        plt.close()
        plt.show()

    @staticmethod
    def draw_bcr_or_tcr_type(data_list, save_path=None):
        labels, counts = np.unique(np.array(data_list), return_counts=True)
        graph = plt.bar(labels, counts, align='center', edgecolor='black')
        # label设置
        plt.xlabel("BCR TCR")
        plt.ylabel("Frequency")
        plt.gca().set_xticks(labels)

        # 绘制百分比
        count_sum = sum(counts)
        percentage_list = []
        for count in counts:
            pct = (count / count_sum) * 100
            percentage_list.append(round(pct, 2))
        i = 0
        max_height = max([p.get_height() for p in graph])
        for p in graph:
            width = p.get_width()
            height = p.get_height()
            x, y = p.get_xy()
            plt.text(x + width / 2,
                     y + height + max_height*0.01,
                     str(percentage_list[i]) + '%',
                     size=8,
                     ha='center',
                     weight='bold')
            i += 1

        # 尺寸以及存储
        fig = plt.gcf()
        fig.set_size_inches(6, 6)
        if save_path:
            plt.savefig(save_path, bbox_inches='tight', pad_inches=0.1)
        else:
            plt.show()
        plt.close()
        plt.show()

    @staticmethod
    def draw_complex_counts(data_list, x_label, save_path=None):
        """
        绘制复合物的链数
        """
        labels, counts = np.unique(np.array(data_list), return_counts=True)
        labels_str = [str(l) for l in labels]
        labels_str[-1] = f">={labels_str[-1]}"

        counts = list(counts)
        graph = plt.bar(labels_str, counts, align='center', edgecolor='black')
        plt.gca().set_xticks(labels_str)

        # label设置
        plt.xlabel(x_label)
        plt.ylabel("Frequency")

        # 绘制百分比
        count_sum = sum(counts)
        percentage_list = []
        for count in counts:
            pct = (count / count_sum) * 100
            percentage_list.append(round(pct, 2))
        i = 0
        max_height = max([p.get_height() for p in graph])
        for p in graph:
            width = p.get_width()
            height = p.get_height()
            x, y = p.get_xy()
            plt.text(x + width / 2,
                     y + height + max_height*0.01,
                     str(percentage_list[i]) + '%',
                     size=8,
                     ha='center',
                     weight='bold')
            i += 1

        # 尺寸以及存储
        fig = plt.gcf()
        if len(labels_str) > 2:
            fig.set_size_inches(12, 6)
        else:
            fig.set_size_inches(6, 6)
        if save_path:
            plt.savefig(save_path, bbox_inches='tight', pad_inches=0.1)
        else:
            plt.show()
        plt.close()

    def process_resolution(self, df):
        """
        处理分辨率
        """
        out_dir = os.path.join(self.rcsb_dir, "charts")
        mkdir_if_not_exist(out_dir)
        df_resolution_unique = df["resolution"].unique()
        df_resolution_unique = sorted(df_resolution_unique)
        print(f"[Info] resolution range: {df_resolution_unique[0]} ~ {df_resolution_unique[-1]}")

        df_resolution = df["resolution"].fillna(-1).astype(int)

        df_resolution[df_resolution >= 10] = 10
        self.draw_resolution(df_resolution, os.path.join(out_dir, "resolution_chain.png"))

        agg_functions = {'pdb': 'first', 'resolution': 'mean'}
        df_resolution_pdb = df.groupby(df['pdb']).aggregate(agg_functions)
        df_resolution_pdb = df_resolution_pdb["resolution"].fillna(-1).astype(int)
        df_resolution_pdb[df_resolution_pdb >= 10] = 10
        self.draw_resolution(df_resolution_pdb, os.path.join(out_dir, "resolution_pdb.png"))

    @staticmethod
    def show_value_counts(data_list):
        labels, counts = np.unique(np.array(data_list), return_counts=True)
        label_res_str = ""
        for label, count in zip(labels, counts):
            label_res_str += f"{label}: {count}, "
        label_res_str = label_res_str[:-2]
        print(f"[Info] value_counts: {label_res_str}, sum: {sum(counts)}")

    def process_seq_len(self, df):
        """
        处理序列长度
        """
        df_len_unique = df["len"].unique()
        df_len_unique = sorted(df_len_unique)
        print(f"[Info] seq len range: {df_len_unique[0]} ~ {df_len_unique[-1]}")
        df_len_all = df.loc[df['len'] >= 20]
        print(f"[Info] len > 20: {len(df_len_all)}, len < 20: {len(df.loc[df['len'] < 20])}")
        df_len = df_len_all["len"].astype(int)
        df_len[df_len >= 1000] = 1000
        df_len = (df_len / 100).astype(int)
        df_len = (df_len * 100).astype(int)
        self.show_value_counts(df_len)
        out_dir = os.path.join(self.rcsb_dir, "charts")
        mkdir_if_not_exist(out_dir)
        self.draw_seq_len(df_len, os.path.join(out_dir, "seq_len.png"))

    def process_chain_type(self, df):
        df_chain_type = df["chain_type"]
        print(f"[Info] chain_type: {df_chain_type.unique()}")
        self.show_value_counts(df_chain_type)

        df_chain_type = df.loc[df["chain_type"] != "protein"]["chain_type"]
        out_dir = os.path.join(self.rcsb_dir, "charts")
        mkdir_if_not_exist(out_dir)
        self.draw_chain_type(df_chain_type, os.path.join(out_dir, "chain_type.png"))

        agg_functions = {'pdb': 'first', 'bcr_or_tcr': 'first'}
        df_btcr = df.groupby(df['pdb']).aggregate(agg_functions)
        df_btcr_type = df_btcr["bcr_or_tcr"]
        print(f"[Info] bcr or tcr type: {df_btcr_type.unique()}")
        self.show_value_counts(df_btcr_type)
        df_btcr_type = df_btcr.loc[df_btcr["bcr_or_tcr"] != "none"]["bcr_or_tcr"]
        self.draw_bcr_or_tcr_type(df_btcr_type, os.path.join(out_dir, "bcr_or_tcr.png"))

    def process_complex(self, df):
        df_pre_len = len(df)
        df = df.loc[df['len'] >= 20]
        df = df.loc[df['len'] <= 500]
        df = df.loc[df["resolution"].fillna(-1).astype(int) > 0]
        df = df.loc[df["resolution"] <= 3]
        df_post_len = len(df)
        print(f"[Info] df_pre_len: {df_pre_len}, df_post_len: {df_post_len}")
        df_pdb = df["pdb"].unique()
        print(f"[Info] Clean PDB样本总数: {len(df_pdb)}")

        df_multimer = df.groupby(['pdb']).size().reset_index(name='counts')
        df_multimer_unique = df_multimer['counts'].unique()
        print(f"[Info] multimer: {df_multimer_unique[0]} - {df_multimer_unique[-1]}")
        df_multimer_counts = df_multimer["counts"].astype(int)
        df_multimer_counts[df_multimer_counts >= 10] = 10
        self.show_value_counts(df_multimer_counts)
        out_dir = os.path.join(self.rcsb_dir, "charts")
        mkdir_if_not_exist(out_dir)
        save_path = os.path.join(out_dir, "complex_chain_num.png")
        self.draw_complex_counts(df_multimer_counts, x_label="Complex Chain Num", save_path=save_path)

        # 同源或异源
        df_multimer_1 = df.groupby(['pdb']).size().reset_index(name='counts')
        df_multimer_2 = df.groupby(['pdb'])['seq'].apply(lambda x: len(set(x))).reset_index(name='unique')
        # print(f"{len(df_multimer_1)}, {len(df_multimer_2)}")
        # df_multimer_3 = df_multimer_2.loc[df_multimer_1["counts"] > 1]
        df_multimer = pd.merge(df_multimer_1, df_multimer_2, on='pdb')  # 根据PDB合并
        # print(f"{len(df_multimer)}")
        # print(f"[Info] df_multimer: \n{df_multimer[:5]}")
        df_multimer_unique = df_multimer.loc[df_multimer["counts"] > 1]["unique"]
        df_multimer_unique = df_multimer_unique.astype(int)
        df_multimer_unique[df_multimer_unique >= 2] = 2
        self.show_value_counts(df_multimer_unique)
        save_path = os.path.join(out_dir, "multimer_unique_num.png")
        self.draw_complex_counts(df_multimer_unique, x_label="Multimer Unique Num", save_path=save_path)

    def process_profiling(self, csv_path):
        print(f"[Info] csv文件: {csv_path}")
        df = pd.read_csv(csv_path)
        # print(df.info())
        df_pdb = df["pdb"].unique()
        print(f"[Info] PDB样本总数: {len(df_pdb)}")
        df_chain = df["chain"].unique()
        print(f"[Info] chain: {sorted(df_chain)}")
        df_release_date = df["release_date"].unique()
        df_release_date = sorted(df_release_date)
        print(f"[Info] release_date {df_release_date[0]} - {df_release_date[-1]}")
        self.process_resolution(df)
        self.process_seq_len(df)
        self.process_chain_type(df)
        self.process_complex(df)

    def process(self):
        self.process_profiling(self.profiling_protein_path)


def main():
    rp = RcsbProcessor()
    rp.process()


if __name__ == '__main__':
    main()