【多目标进化优化】MOPSO 原理与代码实现
博主相信: 有足够的积累,并且一直在路上,就有无限的可能!!!
个人主页: 青年有志的博客
Gitee 源码地址: https://gitee.com/futurelqh/Multi-objective-evolutionary-optimization
前言
前驱知识
- 粒子群优化算法 PSO:https://blog.csdn.net/qq_46450354/article/details/127464089
- Pareto 最优解集: https://blog.csdn.net/qq_46450354/article/details/127917026
粒子群优化算法 PSO
pbest: 粒子本身经历过的最优位置
gbest: 粒子群整体经历过的最优位置
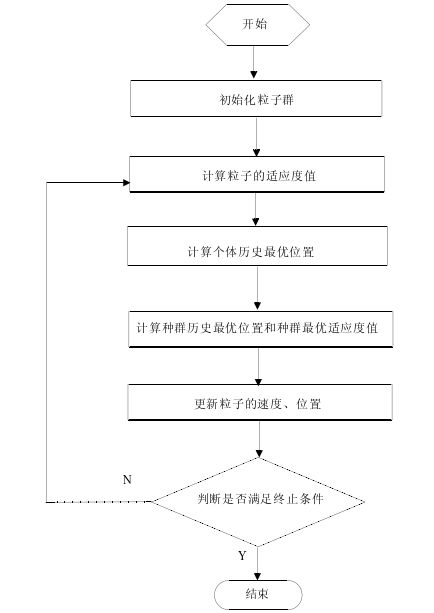
算法思路: 在单目标优化中,通过自我认知 pbest 以及社会认知 gbest 来计算出每个个体下一次移动的速度,从而更新个体所处的位置 x,并更新个体 pbest,以及群体的 gbest,更新的依据直接通过比较目标函数值 function value 的大小即可。


PSO 算法流程图

PSO 引出 MOPSO
- PSO 在用于单目标优化过程中,由于只有一个函数,两个个体之间可以通过直接比较大小来判断好坏,从而判断是否更新 pbest,gbest。
- 在多目标问题中存在多个目标值,比如求两个目标函数的最小值,有两个个体 P 1 = ( 8 , 15 ) , P 2 = ( 10 , 12 ) {P_1} = (8, 15), P_2 = (10, 12) P1=(8,15),P2=(10,12), P 1 {P_1} P1 的第一个目标函数值小于 P 2 {P_2} P2,而第二个目标函数值大于 P 2 P_2 P2,如何判断谁更好呢?
问题:
- 如何更新多目标中的 pbest ?
- 如何更新多目标中的 gbest ?
- 对于多目标优化问题,输出的结果为一个集合,即 rep (非支配集/归档集) ,此集合的大小如何维护 ?
- 并且 PSO 很容易陷入局部最优,如何避免呢?
注: rep 集,在部分文献中会称为 Archive 集,均为同一种,即当前迭代中的的非支配集,也称为归档集,为避免混淆,本文同一使用 rep 。
MOPSO 所解决的正是这些个问题,从而将单目标 PSO,变为了能够高效求解多目标优化的算法。下面我们来看看这些问题是如何解决的
1. 如何更新多目标中的 pbest ?
分为三种情况进行更新:
- ① 当新产生的个体 i 在每个目标函数值上都比 pbest 更优越,则更新 pbest (i 支配 pbest)
- ② 当新产生的个体 i 在每个目标函数值上都比 pbest 更劣,则不更新 (pbest 支配 i)
- ③ 当新产生的个体 i 在部分目标函数值上比 pbest 优越,则随机按照一定的概率进行更新 (i 与 pbest 互不支配)
2. 如何更新多目标中的 gbest ?
- 如何在所有互不支配的个体当中选出这个 leader 个体呢? 这就需要引入自适应网格算法了
自适应网格算法
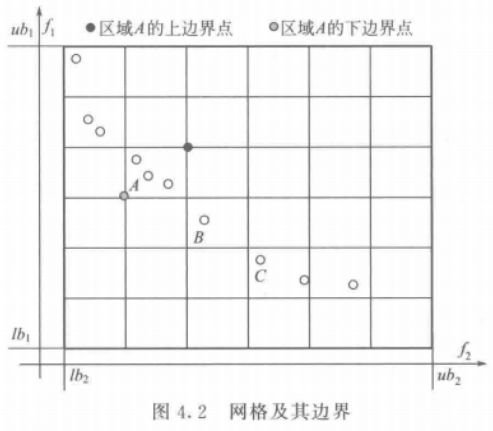
~~~~~~ 算法思路: 将所有个体划分在不同的网格里面,再计算网格的密度,密度越小的网格,粒子越稀疏,个体被选择的概率越大(从而保证粒子的分布性)。具体步骤如下:

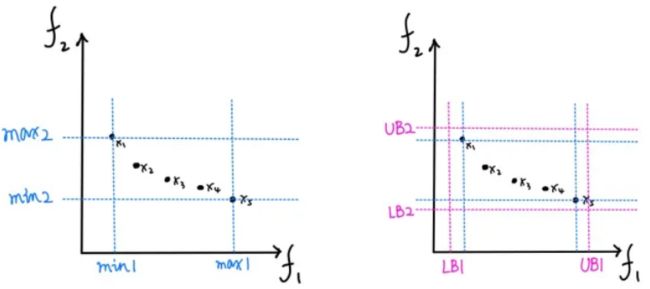
Step1: 遍历集合种群中的所有个体,分别在每一个目标函数上找出所有个体中的最小值和最大值,如图所示,获得目标函数 f 1 f_1 f1 上的最小值 m i n 1 min_1 min1、最大值 m a x 1 max_1 max1,以及目标函数 f 2 f_2 f2 上的最小值 m i n 2 min_2 min2、最大值 m a x 2 max_2 max2。为了保证边界粒子 x 1 、 x 5 x_1、x_5 x1、x5 也能在网格内,需要进行延长操作,把最大最小值根据一定比例稍微延长一点,最后获得网格的边界 L B 1 、 U B 1 、 L B 2 、 U B 2 LB_1、UB_1、LB_2、UB_2 LB1、UB1、LB2、UB2

Step2: 假设设置的参数 n = 3,将网格平均切割成 3 X 3 = 9 个格子

Step3: 摘选出其中有个体的网格,并计算这些网格中存储的个体总数,如:① = 1,② = 1,③ = 1,④ = 2

Step4: 由前面获得的个体数根据公式计算这些网格的被选概率,个体越少被选概率越大,归一化所有网格的被选概率和为 1。
Step5: 根据前面计算的概率,采取轮盘赌方法选择一个网格,该网格中的个体作为 gBest 备选集,在备选集中采用随机选择的方法选择其中一个个体作为全局最优 gBest
3. 如何维护 rep (非支配集/归档集) ?
- 同样可以采取自适应网格算法。即假设在加入新的非支配个体后,rep 库现在的长度是 m ( m > N ) m(m>N) m(m>N),此时我们需要删除 m − N m-N m−N 个个体来保证 rep 不溢出。此时只需要通过自适应网格法从 rep 库中选择出一个最差劲个体然后从rep库中删除,如此循环 m − N m-N m−N 次,问题迎刃而解
-
首先,根据支配关系进行第一轮筛选,将个体自身与上一次相比的劣解去除,即更新 pbest
-
将所有个体根据支配关系进行第二轮筛选,将劣解去除,并加入到 rep 归档集中,并计算个体所处的网格位置
-
最后,若归档集数量超过了存档阀值,则根据自适应网格进行筛选删除,直到阀值限额为止,重新进行网格划分。
4. 如何避免算法陷入局部最优?
Step1: 对当前的粒子 x,根据当前迭代次数 It 和最大迭代次数 MaxIt 以及突变率 m 计算扰乱算子 p。
p = ( 1 − ( I t − 1 ) ( M a x I t − 1 ) ) ( 1 / m ) p = ( 1 -\frac{ ( It - 1 ) }{ ( MaxIt - 1 )} )^ {( 1 / m )} p=(1−(MaxIt−1)(It−1))(1/m)
Step2: 获取随机数 rand,如果 rand < p,随机选择粒子的某个决策变量进行变异,其余决策变量不变;若 rand 不小于 p,则保持不变。
Step3: 如果粒子需要变异,首先随机选择到粒子 x 的第 j 个决策变量 x(j),然后根据扰乱算子计算变异范围 d,
d = p ∗ ( V a r M a x − V a r M i n ) ; d = p * (VarMax-VarMin); d=p∗(VarMax−VarMin);
式中, V a r M a x VarMax VarMax 和 V a r m i n Varmin Varmin 分别是规定的决策变量的最大值和最小值。
Step4: 由 d 计算变异的上下界,上界 U B = x ( j ) + d UB=x(j) + d UB=x(j)+d,下界 L B = x ( j ) − d LB=x(j) - d LB=x(j)−d。同时注意越界处理:
U B = m i n ( U B , V a r m a x ) , L B = m a x ( L B , V a r m i n ) UB=min(UB,Var_{max}),LB=max(LB,Var_{min}) UB=min(UB,Varmax),LB=max(LB,Varmin)
Step5: 最后根据变异的范围 [ L B , U B ] [LB,UB] [LB,UB] 随机获取新的 x ( j ) = u n i f r n d ( l b , u b ) x(j)=unifrnd(lb, ub) x(j)=unifrnd(lb,ub) ,即获得区间 ( l b , u b ) (lb,ub) (lb,ub) 中的一个随机数。
Step6: 在粒子变异后,要比较变异后的粒子是否更优秀,如果变异后的粒子更优秀则更新粒子,否则不更新;同样还要比较新的粒子和粒子的 pBest,若新的粒子比 pBest 优秀则更新 pBest,否则不更新。
算法流程

综上可知 MOPSO 算法主要是针对以下一些问题进行研究:
-
如何选择 pbest。对于多目标来说两个粒子的对比,并不能对比出哪个好一些。如果粒子的每个目标都要好的话,则该粒子更优。若有些更好,有些更差的话,就无法严格的说哪个好些,哪个差一些。
-
如何选择 gbest。对于多目标来说,最优的个体有很多个。该如何选择,涉及到最优个体的存档、存档的管理等问题(多样性/分布性)
-
速度更新公式优化;
-
位置更新处理;
-
增加扰乱算子即变异算子的选择问题,主要是为了解决 PSO 快速收敛到局部最优的问题,增加扰乱可以使得收敛到全局最优
-
增加一些其他的操作来改善收敛性和多样性
补充
- 上述解决方案为较简单的方式,还可以有其他很多方式来解决这三类问题,从而实现不同的算法。
-
速度更新公式的优化,如:引入了一个收缩因子等
-
解决算法快速收敛陷入局部最优的问题,如:变异操作
-
算法收敛性和多样性的实现方式,如本文的自适应网格算法;
-
MOPSO 的存档方法
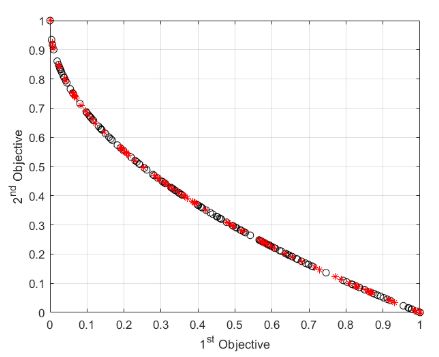
算法执行图
算法在 ZDT1 测试函数下的执行结果

利用综合指标 (HV、IGD) 测试算法在测试函数上的收敛性与分布性,在迭代完成后加上下面两段代码即可:
zdt1.mat:为测试函数 zdt1 的真是 Pareto 解集,在文章开头给出的 Gitee 地址中有
load('zdt1.mat'); % 真实 Pareto 解集
HVResult = HV([rep.Cost]', zdt1)
IGDResult = IGD([rep.Cost]', zdt1)
代码实现
mopso.mlx
Problem Definition
CostFunction = @(x) ZDT(x);      % Cost Function

nVar = 5;             % Number of Decision Variables

VarSize = [1 nVar];   % Size of Decision Variables Matrix

VarMin = 0;          % Lower Bound of Variables
VarMax = 1;          % Upper Bound of Variables
MOPSO Parameters
MaxIt = 200;           % Maximum Number of Iterations

nPop = 200;            % Population Size

nRep = 100;            % Repository Size

w = 0.5;              % Inertia Weight
wdamp = 0.99;         % Intertia Weight Damping Rate
c1 = 1;               % Personal Learning Coefficient
c2 = 2;               % Global Learning Coefficient

nGrid = 7;            % Number of Grids per Dimension
alpha = 0.1;          % Inflation Rate

beta = 2;             % Leader Selection Pressure
gamma = 2;            % Deletion Selection Pressure

mu = 0.1;             % Mutation Rate
Initialization
empty_particle.Position = [];
empty_particle.Velocity = [];
empty_particle.Cost = [];
empty_particle.Best.Position = [];
empty_particle.Best.Cost = [];
empty_particle.IsDominated = [];
empty_particle.GridIndex = [];
empty_particle.GridSubIndex = [];

pop = repmat(empty_particle, nPop, 1);

for i = 1:nPop

    pop(i).Position = unifrnd(VarMin, VarMax, VarSize); % 产生范围内的连续随机数

    pop(i).Velocity = zeros(VarSize);

    pop(i).Cost = CostFunction(pop(i).Position);


    % Update Personal Best
    pop(i).Best.Position = pop(i).Position;
    pop(i).Best.Cost = pop(i).Cost;

end

% Determine Domination
pop = DetermineDomination(pop);

rep = pop(~[pop.IsDominated]); % 选出当前非支配个体

Grid = CreateGrid(rep, nGrid, alpha); % 定义网格

for i = 1:numel(rep)
    rep(i) = FindGridIndex(rep(i), Grid); % 给每个个体分配网格位置
end
MOPSO Main Loop
for it = 1:MaxIt

    for i = 1:nPop

        leader = SelectLeader(rep, beta); % 轮盘赌选择 gbest

        pop(i).Velocity = w*pop(i).Velocity ...
            +c1*rand(VarSize).*(pop(i).Best.Position-pop(i).Position) ...
            +c2*rand(VarSize).*(leader.Position-pop(i).Position);

        % 更新位置
        pop(i).Position = pop(i).Position + pop(i).Velocity;

        % 越界判断
        pop(i).Position = max(pop(i).Position, VarMin);
        pop(i).Position = min(pop(i).Position, VarMax);

        % 计算新的目标值
        pop(i).Cost = CostFunction(pop(i).Position);

        if Dominates(pop(i), pop(i).Best) % 如果 i 支配 Best,则更新 Best
            pop(i).Best.Position = pop(i).Position;
            pop(i).Best.Cost = pop(i).Cost;

        elseif Dominates(pop(i).Best, pop(i)) % 若 Best 支配 i ,则不更新
            % Do Nothing

        else % 若互不支配,则产生随机数判断是否更新
            if rand<0.5
                pop(i).Best.Position = pop(i).Position;
                pop(i).Best.Cost = pop(i).Cost;
            end
        end

    end

    % Add Non-Dominated Particles to REPOSITORY
    rep = [rep
         pop(~[pop.IsDominated])]; %#ok

    % Determine Domination of New Resository Members
    rep = DetermineDomination(rep);

    % Keep only Non-Dminated Memebrs in the Repository
    rep = rep(~[rep.IsDominated]);

    % Update Grid
    Grid = CreateGrid(rep, nGrid, alpha);

    % Update Grid Indices
    for i = 1:numel(rep)
        rep(i) = FindGridIndex(rep(i), Grid);
    end

    % Check if Repository is Full
    if numel(rep)>nRep

        Extra = numel(rep)-nRep;
        for e = 1:Extra
            rep = DeleteOneRepMemebr(rep, gamma);
        end

    end

    % Plot Costs
    figure(1);
    PlotCosts(pop, rep);
    pause(0.01);

    % Show Iteration Information
    disp(['Iteration ' num2str(it) ': Number of Rep Members = ' num2str(numel(rep))]);

    % Damping Inertia Weight
    w = w*wdamp;

end
ZDT.m:测试函数 ZDT1
function z = ZDT(x)
% Function: z = ZDT(x)
%
% Description:  此系列的测试函数总共有 6 个,ZDT1 ~ ZDT6, 属于数值型测试函数,
%               当前实现的测试函数为 ZDT1
%
%
% Syntax:
%
%
% Parameters:
%   x:决策变量
%
% Return:
%   z:函数结果 f1, f2
%
%                  Young99
%         Revision:    Data:
%*************************************************************************

    n = numel(x);

    f1 = x(1);

    g = 1+9/(n-1)*sum(x(2:end));

    h = 1-sqrt(f1/g);

    f2 = g*h;

    z = [f1
       f2];

end
DetermineDomination.m:判断是否为非支配个体
function pop = DetermineDomination(pop)
% Function: pop = DetermineDomination(pop)
%
% Description: 计算个体之间的支配关系,若被其他个体支配,将 IsDominated 设置为 true
%
%
% Syntax:
%
%
% Parameters:
%   pop:种群
%
% Return:
%   pop:进行非支配标记后的种群
%
%                  Young99
%         Revision:1.0     Data: 2022-12-07
%*************************************************************************

    nPop = numel(pop);

    % 初始化每个个体均为非支配个体
    for i = 1:nPop
        pop(i).IsDominated = false;
    end

    % 两两个体比较
    for i = 1:nPop-1
        for j = i+1:nPop

            if Dominates(pop(i), pop(j))
               pop(j).IsDominated = true;
            end

            if Dominates(pop(j), pop(i))
               pop(i).IsDominated = true;
            end

        end
    end

end
Dominates.m:两两个体之间比较大小
function b = Dominates(x, y)
% Function: b = Dominates(x, y)
%
% Description: 比较两个个体的函数值
%
%
% Syntax:
%
%
% Parameters:
%   pop:种群
%
% Return:
%   b:比较结果,为布尔型
%
%                  Young99
%         Revision:1.0     Data: 2022-12-07
%*************************************************************************
    if isstruct(x)
        x = x.Cost;
    end

    if isstruct(y)
        y = y.Cost;
    end

    b = all(x <= y) && any(x
CreateGrid.m:创建自适应网格
function Grid = CreateGrid(pop, nGrid, alpha)
% Function: Grid = CreateGrid(pop, nGrid, alpha)
%
% Description: 为每一个目标函数,选出 pop 中个体目标函数值的最小及最大值
%              将最小最大值利用 alpha 参数扩展一定的范围,作为当前维度网格的上下限
%
%
% Syntax:
%
%
% Parameters:
%   pop:rep 即为当前轮的非支配个体
%   nGrid:网格的维度大小
%   alpha:自定义参数,用于调整网格的最大最小上下线
%
% Return:
%   Grid:定义后的网格
%
%                  Young99
%         Revision:1.0     Data: 2022-12-07
%*************************************************************************

    c = [pop.Cost];

    cmin = min(c, [], 2);
    cmax = max(c, [], 2);

    dc = cmax-cmin;
    cmin = cmin-alpha*dc;
    cmax = cmax+alpha*dc;

    nObj = size(c, 1);

    empty_grid.LB = [];
    empty_grid.UB = [];
    Grid = repmat(empty_grid, nObj, 1);

    for j = 1:nObj

        cj = linspace(cmin(j), cmax(j), nGrid+1);

        Grid(j).LB = [-inf cj];
        Grid(j).UB = [cj +inf];

    end

end
FindGridIndex.m:为每个个体确定在网格中的位置
function particle = FindGridIndex(particle, Grid)
% Function: particle = FindGridIndex(particle, Grid)
%
% Description: 为 rep 中的每个个体划分所在的网格,其中
%              GridSubIndex 表示每维目标所对应的网格位置
%              GridIndex 表示将 GridSubIndex 归并为一个数来表示
%
%
% Syntax:
%
%
% Parameters:
%   particle:当前非支配集中的一个个体
%   Grid:已经划分好的网格,用于自适应网格算法
%
% Return:
%   particle:划分到对应网格后的个体
%
%                  Young99
%         Revision:1.0     Data: 2022-12-07
%*************************************************************************
    nObj = numel(particle.Cost);

    nGrid = numel(Grid(1).LB);

    particle.GridSubIndex = zeros(1, nObj);

    for j = 1:nObj

        particle.GridSubIndex(j) = ...
            find(particle.Cost(j)
SelectLeader.m:利用网格聚集密度选择 gBest
function leader = SelectLeader(rep, beta)
% Function: leader = SelectLeader(rep, beta)
%
% Description: 利用轮盘赌选出其中一个网格,网格聚集密度越小,越容易被选中,
%              再在选中的网格中随机选出一个个体作为 leader 即 gbest
%
%
% Syntax:
%
%
% Parameters:
%   rep:当前迭代的非支配个体
%   beta:自定义参数
%
% Return:
%   leader:被选中的 gbest
%
%                  Young99
%         Revision:1.0     Data: 2022-12-07
%*************************************************************************


    % Grid Index of All Repository Members
    GI = [rep.GridIndex];

    % Occupied Cells
    OC = unique(GI);

    % Number of Particles in Occupied Cells
    N = zeros(size(OC));
    for k = 1:numel(OC)
        N(k) = numel(find(GI == OC(k)));
    end

    % Selection Probabilities
    P = exp(-beta*N);  % 注意这是有负数,表示个体数越多的网格被选择的概率越小
    P = P/sum(P); % 转化为和为 1 的概率

    % Selected Cell Index
    sci = RouletteWheelSelection(P);

    % Selected Cell
    sc = OC(sci);

    % Selected Cell Members
    SCM = find(GI == sc);

    % Selected Member Index,random selection
    smi = randi([1 numel(SCM)]);

    % Selected Member
    sm = SCM(smi);

    % Leader
    leader = rep(sm);

end
RouletteWheelSelection.m: 轮盘赌
function i = RouletteWheelSelection(P)
% 轮盘赌用于选择某个网格
    r = rand;

    C = cumsum(P);

    i = find(r <= C, 1, 'first');

end
Mutation.m:变异操作
function particle = Mutation(particle, pm, VarMin, VarMax)
% Function: particle = Mutation(particle, pm, VarMin, VarMax)
%
% Description: 随机选择一个决策变量进行变异,避免陷入局部最优
%
%
% Syntax:
%
%
% Parameters:
%   particle:个体决策变量
%   pm:扰乱算子
%   VarMin:变量最小值
%   VarMax:变量最大值
%
% Return:
%   particle:变异后的个体
%
%                  99Young99
%         Revision:1.0     Data: 2022-12-09
%*************************************************************************


    nVar = numel(particle);
    p = randi([1 nVar]); % 随机选取一个变异位置 p

    x = particle(p);

    d = pm * (VarMax - VarMin);
    ub = x + d;
    lb = x - d;
    ub = min(ub, VarMax);
    lb = max(lb, VarMin);

    x = unifrnd(lb, ub, 1);

    particle(p) = x;

end
DeleteOneRepMemebr.m:当 rep 超出阈值,进行删除操作
function rep = DeleteOneRepMemebr(rep, gamma)
% Function: rep = DeleteOneRepMemebr(rep, gamma)
%
% Description: 利用轮盘赌选出其中一个网格,网格聚集密度越大,越容易被选中,
%              再在选中的网格中随机选出一个个体删除
%
%
% Syntax:
%
%
% Parameters:
%   rep:当前迭代的非支配个体
%   beta:自定义参数
%
% Return:
%   leader:被选中的 gbest
%
%                  Young99
%         Revision:1.0     Data: 2022-12-07
%*************************************************************************
    % Grid Index of All Repository Members
    GI = [rep.GridIndex];

    % Occupied Cells
    OC = unique(GI);

    % Number of Particles in Occupied Cells
    N = zeros(size(OC));
    for k = 1:numel(OC)
        N(k) = numel(find(GI == OC(k)));
    end

    % Selection Probabilities
    P = exp(gamma*N);
    P = P/sum(P);

    % Selected Cell Index
    sci = RouletteWheelSelection(P);

    % Selected Cell
    sc = OC(sci);

    % Selected Cell Members
    SCM = find(GI == sc);

    % Selected Member Index
    smi = randi([1 numel(SCM)]);

    % Selected Member
    sm = SCM(smi);

    % Delete Selected Member
    rep(sm) = [];

end
PlotCosts.m:画图可视化
function PlotCosts(pop, rep)

    pop_costs = [pop.Cost];
    plot(pop_costs(1, :), pop_costs(2, :), 'ko');
    hold on;

    rep_costs = [rep.Cost];
    plot(rep_costs(1, :), rep_costs(2, :), 'r*');

    xlabel('1^{st} Objective');
    ylabel('2^{nd} Objective');

    grid on;

    hold off;

end
HV.m
function [Score,PopObj] = HV(PopObj,PF)
%
% Hypervolume

%------------------------------- Reference --------------------------------
% E. Zitzler and L. Thiele, Multiobjective evolutionary algorithms: A
% comparative case study and the strength Pareto approach, IEEE
% Transactions on Evolutionary Computation, 1999, 3(4): 257-271.
%------------------------------- Copyright --------------------------------
% Copyright (c) 2018-2019 BIMK Group. You are free to use the PlatEMO for
% research purposes. All publications which use this platform or any code
% in the platform should acknowledge the use of "PlatEMO" and reference "Ye
% Tian, Ran Cheng, Xingyi Zhang, and Yaochu Jin, PlatEMO: A MATLAB platform
% for evolutionary multi-objective optimization [educational forum], IEEE
% Computational Intelligence Magazine, 2017, 12(4): 73-87".
%--------------------------------------------------------------------------

%
% 这段代码是用来计算超体积指标的。它包含了一个 HV 函数,用于计算超体积指标,并输出其值和输入种群的结果。
%
% HV 函数的输入参数包括种群结果 PopObj 和理论最优结果 PF。它首先会将种群结果进行归一化,然后根据超体积指标的定义,计算种群结果与理论最优结果的相似度。
%
% 最后,HV 函数会输出计算得到的超体积指标值和归一化后的种群结果。


    % Normalize the population according to the reference point set
    [N,M]  = size(PopObj);
    fmin   = min(min(PopObj,[],1),zeros(1,M));
    fmax   = max(PF,[],1);
    PopObj = (PopObj-repmat(fmin,N,1))./repmat((fmax-fmin)*1.1,N,1);
    PopObj(any(PopObj>1,2),:) = [];
    % The reference point is set to (1,1,...)
    RefPoint = ones(1,M);
    if isempty(PopObj)
        Score = 0;
    elseif M < 4
        % Calculate the exact HV value
        pl = sortrows(PopObj);
        S  = {1,pl};
        for k = 1 : M-1
            S_ = {};
            for i = 1 : size(S,1)
                Stemp = Slice(cell2mat(S(i,2)),k,RefPoint);
                for j = 1 : size(Stemp,1)
                    temp(1) = {cell2mat(Stemp(j,1))*cell2mat(S(i,1))};
                    temp(2) = Stemp(j,2);
                    S_      = Add(temp,S_);
                end
            end
            S = S_;
        end
        Score = 0;
        for i = 1 : size(S,1)
            p     = Head(cell2mat(S(i,2)));
            Score = Score + cell2mat(S(i,1))*abs(p(M)-RefPoint(M));
        end
    else
        % Estimate the HV value by Monte Carlo estimation
        SampleNum = 1000000;
        MaxValue  = RefPoint;
        MinValue  = min(PopObj,[],1);
        Samples   = unifrnd(repmat(MinValue,SampleNum,1),repmat(MaxValue,SampleNum,1));
        if gpuDeviceCount > 0
            % GPU acceleration
            Samples = gpuArray(single(Samples));
            PopObj  = gpuArray(single(PopObj));
        end
        for i = 1 : size(PopObj,1)
            drawnow();
            domi = true(size(Samples,1),1);
            m    = 1;
            while m <= M && any(domi)
                domi = domi & PopObj(i,m) <= Samples(:,m);
                m    = m + 1;
            end
            Samples(domi,:) = [];
        end
        Score = prod(MaxValue-MinValue)*(1-size(Samples,1)/SampleNum);
    end
end

function S = Slice(pl,k,RefPoint)
    p  = Head(pl);
    pl = Tail(pl);
    ql = [];
    S  = {};
    while ~isempty(pl)
        ql  = Insert(p,k+1,ql);
        p_  = Head(pl);
        cell_(1,1) = {abs(p(k)-p_(k))};
        cell_(1,2) = {ql};
        S   = Add(cell_,S);
        p   = p_;
        pl  = Tail(pl);
    end
    ql = Insert(p,k+1,ql);
    cell_(1,1) = {abs(p(k)-RefPoint(k))};
    cell_(1,2) = {ql};
    S  = Add(cell_,S);
end

function ql = Insert(p,k,pl)
    flag1 = 0;
    flag2 = 0;
    ql    = [];
    hp    = Head(pl);
    while ~isempty(pl) && hp(k) < p(k)
        ql = [ql;hp];
        pl = Tail(pl);
        hp = Head(pl);
    end
    ql = [ql;p];
    m  = length(p);
    while ~isempty(pl)
        q = Head(pl);
        for i = k : m
            if p(i) < q(i)
                flag1 = 1;
            else
                if p(i) > q(i)
                    flag2 = 1;
                end
            end
        end
        if ~(flag1 == 1 && flag2 == 0)
            ql = [ql;Head(pl)];
        end
        pl = Tail(pl);
    end
end

function p = Head(pl)
    if isempty(pl)
        p = [];
    else
        p = pl(1,:);
    end
end

function ql = Tail(pl)
    if size(pl,1) < 2
        ql = [];
    else
        ql = pl(2:end,:);
    end
end

function S_ = Add(cell_,S)
    n = size(S,1);
    m = 0;
    for k = 1 : n
        if isequal(cell_(1,2),S(k,2))
            S(k,1) = {cell2mat(S(k,1))+cell2mat(cell_(1,1))};
            m = 1;
            break;
        end
    end
    if m == 0
        S(n+1,:) = cell_(1,:);
    end
    S_ = S;
end
IGD.m
function Score = IGD(PopObj,PF)

% PopObej:算法求得的非支配解集
% PF:真实 Pareto 解集

%
% Inverted generational distance

%------------------------------- Reference --------------------------------
% C. A. Coello Coello and N. C. Cortes, Solving multiobjective optimization
% problems using an artificial immune system, Genetic Programming and
% Evolvable Machines, 2005, 6(2): 163-190.
%------------------------------- Copyright --------------------------------
% Copyright (c) 2018-2019 BIMK Group. You are free to use the PlatEMO for
% research purposes. All publications which use this platform or any code
% in the platform should acknowledge the use of "PlatEMO" and reference "Ye
% Tian, Ran Cheng, Xingyi Zhang, and Yaochu Jin, PlatEMO: A MATLAB platform
% for evolutionary multi-objective optimization [educational forum], IEEE
% Computational Intelligence Magazine, 2017, 12(4): 73-87".
%--------------------------------------------------------------------------

    % 通过 pdist 计算 PF 与 PopObj 两两欧式距离,通过 min 取每一行的最小值作为列向量
    % 最后再取所有距离的平均值,越小说明分布性和收敛性越

    Distance = min(pdist2(PF,PopObj),[],2);
    Score    = mean(Distance);
end
Reference
部分理论来源于网络,如有侵权请联系删除