C++性能测试工具——gperftools的安装
一、软件安装说明
gperftools的安装有两种方式,一种是源码方式,一种是直接安装模式。这里使用源码安装模式,原因是使用直接安装模式比较简单。安装此软件需要先安装libunwind这个软件,所以这里需要通过源码方式安装libunwind,否则会报一个警告:“configure: WARNING: No frame pointers and no libunwind. Using experimental backtrace capturing via libgcc.Expect crashy cpu profiler”。
好,下面就在ubuntu20 Server上安装一下gperftools。
二、环境安装配置
1、在github上有安装过程(https://github.com/NIGHTFIGHTING/gperftools-tutorial),但不同的环境还是有所不同,上面使用的是CentOS。这里使用的Ubuntu20 Server。
2、源码安装libunwind
使用下面的命令:
wget https://github.com/libunwind/libunwind/archive/v0.99.tar.gz
tar -xvf v0.99.tar.gz
cd libunwind-0.99
autoreconf --force -v --install
./configure --prefix=/xxx/gperftools-tutorial/output  (此处可不使用--prefix,也可自定义路径如xxx)
make
sudo make install
这里遇到了一个比较麻烦的问题,没有这个autoconf(autoreconf是一个东西)软件,安装autoreconf时,“sudo apt install autoreconf”,总是报“Certificate verification failed: The certificate is NOT trusted.”这个错误,当然罗,是一大堆,不只上面一个,但基本都是这个问题。网上有两种方式来处理类似问题,一种是修正时间,另外一个是先把下载源修改成http,更新证书,然后再改回到https,再次更新后,即可使用。通过验证第一种方法可以,解决的具体方法如下:
先打开源管理文件:
sudo vim /etc/apt/sources.list
修改相关镜像为http:
deb http://mirrors.tuna.tsinghua.edu.cn/ubuntu/ bionic main restricted universe multiverse
deb http://mirrors.tuna.tsinghua.edu.cn/ubuntu/ bionic-updates main restricted universe multiverse
deb http://mirrors.tuna.tsinghua.edu.cn/ubuntu/ bionic-backports main restricted universe multiverse
deb http://mirrors.tuna.tsinghua.edu.cn/ubuntu/ bionic-security main restricted universe multiverse
更新源更新:
sudo apt-get update
安装证书:
sudo apt-get install --reinstall ca-certificates
修改回https:
打开源如第一步相同,然后:
deb https://mirrors.tuna.tsinghua.edu.cn/ubuntu/ bionic main restricted universe multiverse
deb https://mirrors.tuna.tsinghua.edu.cn/ubuntu/ bionic-updates main restricted universe multiverse
deb https://mirrors.tuna.tsinghua.edu.cn/ubuntu/ bionic-backports main restricted universe multiverse
deb https://mirrors.tuna.tsinghua.edu.cn/ubuntu/ bionic-security main restricted universe multiverse
再次更新源:
sudo apt-get update
然后即可安装相关软件,如上面的autoconf.
完成安装后又遇到再问题“unknown type name ‘pthread_mutex_t’”。这个可能有的环境不会出现,有的会出现,解决的方法如下:
在源码文件中include/dwarf.h中增加:
#include 再次make,又出现“ ‘longjmp’ aliased to undefined symbol ’ _ longjmp’ ”,它需要修改一下configure文件,具体的修改方式如下:
//打开configure文件
vim configure
//查找CFLAGS
/CFLAGS
//找到如下语句并增加CFLAGS="${CFLAGS} -fexceptions -Wall -Wsign-compare"的后面添加-U_FORTIFY_SOURCE
16974 if test x$GCC = xyes -a x$intel_compiler != xyes; then
16975   CFLAGS="${CFLAGS} -fexceptions -Wall -Wsign-compare -U_FORTIFY_SOURCE"  ---此处添加
16976   LIBCRTS="-lgcc"
16977 fi
16978
16979 CCASFLAGS="${CCASFLAGS} ${CPPFLAGS}"
16980
16981 arch="$target_arch"
16982 ARCH=`echo $target_arch | tr a-z A-Z`
再次重新执行:
./configure [--prefix=/xxx/gperftools-tutorial/output]
make
sudo make install
3、源码安装gperftools
获得源码文件(二者均可):
wget https://github.com/gperftools/gperftools/archive/master.zip
wget https://github.com/gperftools/gperftools/releases/download/gperftools-2.6.1/gperftools-2.6.1.tar.gz

生成配置文件并编译
./autogen.sh
./configure [--prefix=/xxx/gperftools-tutorial/output] //如果想简单直接省略即可
make
make install
三、命令行安装libunwind
1、安装libunwind使用如下命令:
yum search libunwind # 查找,然后选择需要的安装
yum install libunwind-devel.x86_64
2、禁用libunwind
可以使用补丁:
如果需要用cmake的方式并且不想链接libwind,需要打一个 patch https://github.com/gperftools/gperftools/pull/1260
参考:https://www.cnblogs.com/stdpain/p/14528294.html?ivk_sa=1024320u
四、测试例程
在gperftools的分析应用中有三种方式:
There are several alternatives to actually turn on CPU profiling for a given run of an executable:

Define the environment variable CPUPROFILE to the filename to dump the profile to. For instance, if you had a version of /bin/ls that had been linked against libprofiler, you could run:

% env CPUPROFILE=ls.prof /bin/ls
In addition to defining the environment variable CPUPROFILE you can also define CPUPROFILESIGNAL. This allows profiling to be controlled via the signal number that you specify. The signal number must be unused by the program under normal operation. Internally it acts as a switch, triggered by the signal, which is off by default. For instance, if you had a copy of /bin/chrome that had been been linked against libprofiler, you could run:

% env CPUPROFILE=chrome.prof CPUPROFILESIGNAL=12 /bin/chrome &
You can then trigger profiling to start:

% killall -12 chrome
Then after a period of time you can tell it to stop which will generate the profile:

% killall -12 chrome
In your code, bracket the code you want profiled in calls to ProfilerStart() and ProfilerStop(). (These functions are declared in .) ProfilerStart() will take the profile-filename as an argument.
在前面提到过第二种方式,通过信号处理应用进程的监测的启停,这里使用第三种方式来测试一下:
#include 编译:
f:~/testtool$ g++ -o test test.cpp
In file included from test.cpp:1:
/usr/local/include/google/profiler.h:35:2: warning: #warning "google/profiler.h is deprecated. Use gperftools/profiler.h instead" [-Wcpp]
   35 | #warning "google/profiler.h is deprecated. Use gperftools/profiler.h instead"
      |  ^~~~~~~
/usr/bin/ld: /tmp/ccRcMZ7I.o: in function `main':
test.cpp:(.text+0x81): undefined reference to `ProfilerStart'
/usr/bin/ld: test.cpp:(.text+0x9c): undefined reference to `ProfilerStop'
collect2: error: ld returned 1 exit status
f:~/testtool$ g++ -o test test.cpp -lprofiler -lunwind
In file included from test.cpp:1:
/usr/local/include/google/profiler.h:35:2: warning: #warning "google/profiler.h is deprecated. Use gperftools/profiler.h instead" [-Wcpp]
   35 | #warning "google/profiler.h is deprecated. Use gperftools/profiler.h instead"
      |  ^~~~~~~
f:~/testtool$ ls
test  test.cpp
f:~/testtool$ ./test
./test: error while loading shared libraries: libprofiler.so.0: cannot open shared object file: No such file or directory
需要设置一下库的路径:
export LD_LIBRARY_PATH=/usr/local/lib

export PATH=$PATH:/usr/local/bin
这是一种临时的方法,如果想一直使用,可以修改一下.conf文件。然后再执行一下:
f:~/testtool$ export LD_LIBRARY_PATH=/usr/local/lib
f:~/testtool$ ./test
PROFILE: interrupts/evictions/bytes = 43/7/680
OK!!f@f:~/testtool$ ls
test  test.cpp  test.prof
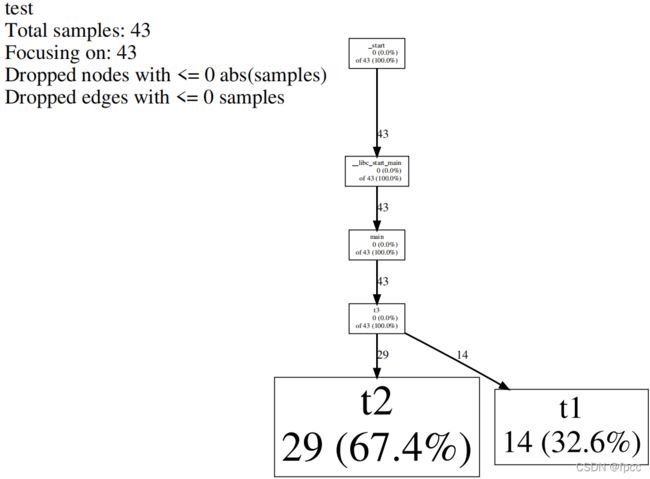
执行分析:
f:~/testtool$ pprof --text test test.prof
Using local file test.
Using local file test.prof.
Total: 43 samples
      27  62.8%  62.8%       27  62.8% t2
      16  37.2% 100.0%       16  37.2% t1
       0   0.0% 100.0%       43 100.0% __libc_start_main
       0   0.0% 100.0%       43 100.0% _start
       0   0.0% 100.0%       43 100.0% main
       0   0.0% 100.0%       43 100.0% t3
如果需要看pdf图形相关分析,需要安装pdf及图形绘制相关软件支持:
sudo apt install ghostscript -y
sudo apt-get install graphviz -y
否则会报:
“ps2pdf command not found”
“sh: 1: dot: not found”
执行:
pprof --pdf test test.prof > tmp.pdf
打开PDF文件,即可看到类似下面的图片:
在下面这个网址上有更详细的说明:
https://gperftools.github.io/gperftools/cpuprofile.html
五、总结
安装gperftools这个测试工具,还是有一些小麻烦的,这里一次统一解决掉,让安装轻松一些。
努力吧,归来的少年!