1. 背景介绍
2. 导库
import numpy as np
import xarray as xr
import matplotlib.pyplot as plt
from matplotlib.cm import get_cmap
import cartopy.crs as ccrs
import cartopy.feature as cfeat
import cartopy.io.shapereader as shpreader
from cartopy.mpl.gridliner import LONGITUDE_FORMATTER, LATITUDE_FORMATTER
import matplotlib.ticker as mticker
from netCDF4 import Dataset
from wrf import to_np, getvar, interplevel, ALL_TIMES, latlon_coords, get_cartopy
import warnings
warnings.filterwarnings('ignore')
3. 准备工作: 兰伯特刻度线补丁子程序
from copy import copy
import numpy as np
import shapely.geometry as sgeom
import cartopy.crs as ccrs
def find_side(ls, side):
"""
Given a shapely LineString which is assumed to be rectangular, return the
line corresponding to a given side of the rectangle.
"""
minx, miny, maxx, maxy = ls.bounds
points = {'left': [(minx, miny), (minx, maxy)],
'right': [(maxx, miny), (maxx, maxy)],
'bottom': [(minx, miny), (maxx, miny)],
'top': [(minx, maxy), (maxx, maxy)],}
return sgeom.LineString(points[side])
def lambert_xticks(ax, ticks):
"""Draw ticks on the bottom x-axis of a Lambert Conformal projection."""
te = lambda xy: xy[0]
lc = lambda t, n, b: np.vstack((np.zeros(n) + t, np.linspace(b[2], b[3], n))).T
xticks, xticklabels = _lambert_ticks(ax, ticks, 'bottom', lc, te)
ax.xaxis.tick_bottom()
ax.set_xticks(xticks)
ax.set_xticklabels([ax.xaxis.get_major_formatter()(xtick) for xtick in xticklabels])
def lambert_yticks(ax, ticks):
"""Draw ticks on the left y-axis of a Lamber Conformal projection."""
te = lambda xy: xy[1]
lc = lambda t, n, b: np.vstack((np.linspace(b[0], b[1], n), np.zeros(n) + t)).T
yticks, yticklabels = _lambert_ticks(ax, ticks, 'left', lc, te)
ax.yaxis.tick_left()
ax.set_yticks(yticks)
ax.set_yticklabels([ax.yaxis.get_major_formatter()(ytick) for ytick in yticklabels])
def _lambert_ticks(ax, ticks, tick_location, line_constructor, tick_extractor):
"""Get the tick locations and labels for an axis of a Lambert Conformal projection."""
outline_patch = sgeom.LineString(ax.outline_patch.get_path().vertices.tolist())
axis = find_side(outline_patch, tick_location)
n_steps = 30
extent = ax.get_extent(ccrs.PlateCarree())
_ticks = []
for t in ticks:
xy = line_constructor(t, n_steps, extent)
proj_xyz = ax.projection.transform_points(ccrs.Geodetic(), xy[:, 0], xy[:, 1])
xyt = proj_xyz[..., :2]
ls = sgeom.LineString(xyt.tolist())
locs = axis.intersection(ls)
if not locs:
tick = [None]
else:
tick = tick_extractor(locs.xy)
_ticks.append(tick[0])
ticklabels = copy(ticks)
while True:
try:
index = _ticks.index(None)
except ValueError:
break
_ticks.pop(index)
ticklabels.pop(index)
return _ticks, ticklabels
4. 读取变量
wrfout_dir = "./data/wrfout_d02_2017-08-22_12"
wrfout = Dataset(wrfout_dir, mode="r")
it = 8
pres = getvar(wrfout, "pressure", timeidx=it)
ua = getvar(wrfout, "ua", units="m/s", timeidx=it)
va = getvar(wrfout, "va", units="m/s", timeidx=it)
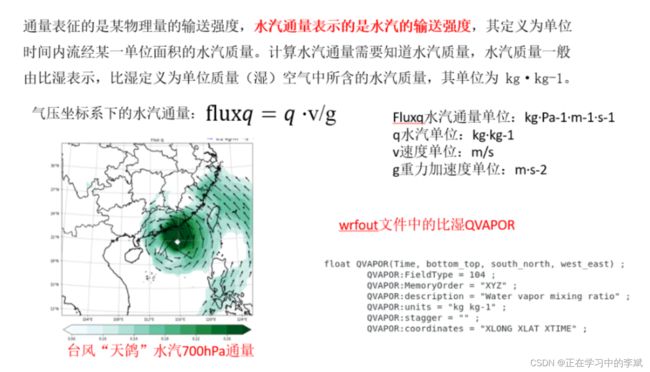
q = getvar(wrfout, "QVAPOR", timeidx=it)
times = getvar(wrfout, "times", meta=False, timeidx=ALL_TIMES)
5. 水平插值与掩膜设置
q_700 = interplevel(q, pres, 700)
u_700 = interplevel(ua, pres, 700)
v_700 = interplevel(va, pres, 700)
qu = q_700*u_700/9.8
qv = q_700*v_700/9.8
quv = np.sqrt(qu**2+qv**2)
quv_masked = np.where(quv<0.02, np.nan, quv)
qu_masked = np.where(quv<0.02, np.nan, qu)
qv_masked = np.where(quv<0.02, np.nan, qv)
6. 经纬度和投影
lats, lons = latlon_coords(q_700)
wrf_proj = get_cartopy(q_700)
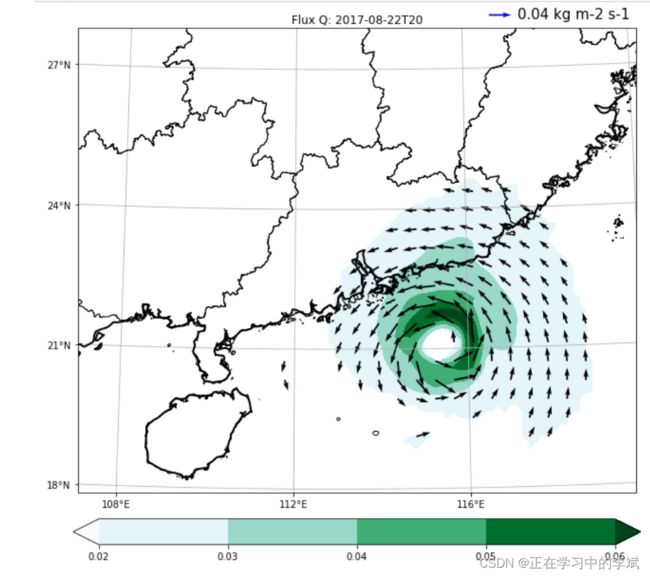
7. 画水汽通量图
fig = plt.figure(figsize=(12,10))
ax = plt.axes(projection=wrf_proj )
province = shpreader.Reader('./data/china_shp/province.shp').geometries()
ax.add_geometries(province, ccrs.PlateCarree(), facecolor='none', edgecolor='black', zorder=10)
ax.coastlines('50m', linewidth=2.0, edgecolor="black",zorder=10)
levels = np.arange(0.02, 0.07, 0.01)
cts = plt.contourf(lons,
lats,
quv_masked,
levels=levels,
transform=ccrs.PlateCarree(),
cmap=get_cmap("BuGn"),
zorder=1,
extend='both')
plt.colorbar(cts, ax=ax, orientation="horizontal", pad=.05, fraction=0.05)
plt.title('Flux Q: ' + str(times[it])[:13])
sk = 3
vc = ax.quiver(
to_np(lons[::sk,::sk]),
to_np(lats[::sk,::sk]),
to_np(qu_masked[::sk,::sk]),
to_np(qv_masked[::sk,::sk]),
width = 0.003,
scale = 1.0,
color = 'black',
transform=ccrs.PlateCarree(),
)
ax.quiverkey(vc,
X=0.7, Y=0.9,
U=0.04,
label = r'0.04 kg m-2 s-1',
labelpos = 'E',
color = 'b',
labelcolor = 'k',
coordinates='figure',
fontproperties={'size': 15}
)
fig.canvas.draw()
lon_max = int(np.max(lons))
lon_min = int(np.min(lons))
lat_max = int(np.max(lats))
lat_min = int(np.min(lats))
xticks = list(np.arange(lon_min-2, lon_max+2, 4.))
yticks = list(np.arange(lat_min-2, lat_max+2, 3.))
ax.gridlines(xlocs=xticks, ylocs=yticks)
ax.xaxis.set_major_formatter(LONGITUDE_FORMATTER)
ax.yaxis.set_major_formatter(LATITUDE_FORMATTER)
lambert_xticks(ax, xticks)
lambert_yticks(ax, yticks)
plt.savefig('wrf_flux_q_700hPa.png')