利用chatgpt处理Excel数据
一 前言
以前用chatgpt主要做问答,这次加入星球学习到了如何用chatgpt处理Excel,虽然现在处理起来还不是很方便,用熟悉了(主要是熟悉提示词),处理起来会越来越快的。
二 准备工作
一个可用的chatgpt账号,或者是申请通过new bing的测试账号。其他条件:
浏览器用Edge。
装上了Mod Header插件配置X-Forwarded-For值为8.8.8.8
科学上网了,将浏览器的位置信息禁止掉。
安装Edge插件chattonai即chatgpt中文,以前我就算科学上网也无法访问chatgpt,通过点击这个插件跳转到chatgpt的主页竟然是ok的,也可以正常登录。

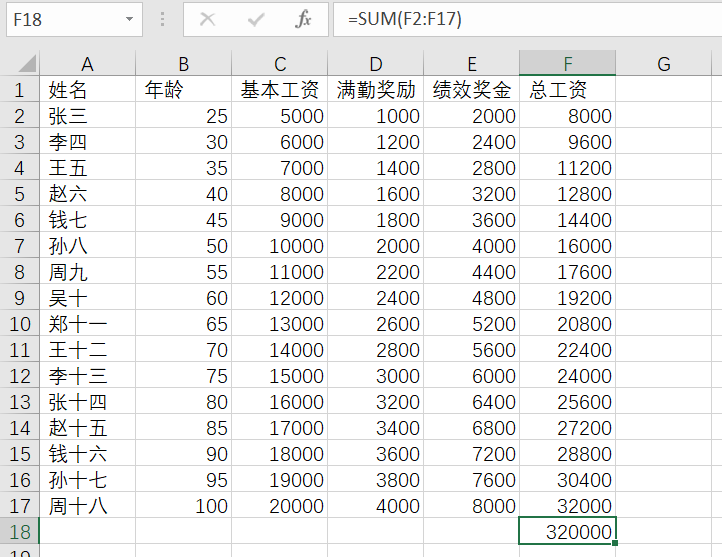
三 准备数据
由于我的新的Edge的版本安装多次都有问题,想了很多办法,都无法安装,最后采用用skype的bing机器人,我感觉这个机器人和skype的效果差不多。
四 利用ai帮我们做点事
4.1 基本公式
如果我们需要对所有的工资求和,但是忘记了求和公式,可以问它: 计算结果如下:
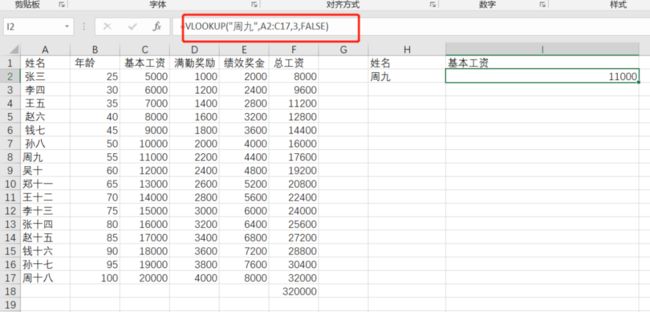
如果想查询周九的基本工资,可以问下bing具体的Excel公式:
五 做点更复杂的事情
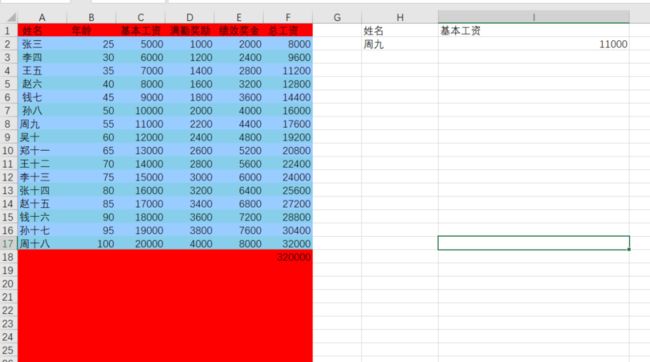
我们知道Excel中,VBA脚本可以完成更复杂的操作,假如我们需要将标题设置成红色,下面每一行奇数行设置为蓝色,偶数行设置为淡蓝色。根据我们的要求设置提示词:"写VBA,第一行A列到F列设置为红色,从第二行开始奇数行设置为蓝色,偶数行设置为淡蓝色"
5.1 设置表格样式VBA脚本
问下bing如何写这个VBA 没有告诉我们具体如何新建VBA等,可以问下chatgpt,看看是否可以回单的更详细点:
关闭窗口后,按Alt+F8,进行选择我们新建的宏,应用效果: 发现有点不对,为啥后面的行都设置为红色了,重新更改提示词询问:"写入VBA时,将第一行A到F列设置为红色,从第二行到最后一行,将奇数行设置为蓝色,将偶数行设置为浅蓝色"
 仍然不对:
仍然不对: 在更改提示词询问:" When writing VBA, set the background color of the first row A to F to red; from the second row to the last row, set the background color of odd rows to blue, set the background color of even rows to light blue, and do not set it if there is no data in this row."
这次提供的vba脚本就没问题了:
Sub FormatRows()
    Dim lastRow As Long
    lastRow = Cells(Rows.Count, "A").End(xlUp).Row 'get last row with data

    'set format for first row
    Range("A1:F1").Interior.Color = RGB(255, 0, 0) 'set red color for columns A to F in row 1

    'set format for odd and even rows with data
    For i = 2 To lastRow 'loop through rows with data
        If WorksheetFunction.CountA(Range("A" & i & ":F" & i)) > 0 Then 'check if row has data
            If i Mod 2 = 0 Then 'check if row number is even
                Range("A" & i & ":F" & i).Interior.Color = RGB(135, 206, 235) 'set light blue color for columns A to F in even rows
            Else 'row number is odd
                Range("A" & i & ":F" & i).Interior.Color = RGB(153, 204, 255) 'set blue color for columns A to F in odd rows
            End If
        End If
    Next i
End Sub
最终更改样式脚本
5.2 生成统计图的vba脚本
提示词:"写VBA程序,数据范围C2到C17的数据,在当前工作区生成柱状图,其中5000到10000一个区间,10000到15000一个区间,15000以上作为一个区间,柱状图的标题为基本工资统计" bing给出的vba脚本:
您好,您可以使用以下代码来生成柱状图:

Sub CreateChart()
Dim MyChart As Chart
Set MyChart = ActiveSheet.Shapes.AddChart2(251, xlColumnClustered).Chart
MyChart.SetSourceData Source:=Range("C2:C17")
MyChart.HasTitle = True
MyChart.ChartTitle.Text = "基本工资统计"
MyChart.Axes(xlCategory).TickLabels.NumberFormatLocal = "0.00"
MyChart.Axes(xlValue).TickLabels.NumberFormatLocal = "0.00"
MyChart.Axes(xlValue).MinimumScale = 5000
MyChart.Axes(xlValue).MaximumScale = 15000
MyChart.Axes(xlValue).MajorUnit = 5000
End Sub

这段代码将数据范围C2到C17的数据生成柱状图,并将5000到10000,10000到15000,15000以上作为三个区间。柱状图的标题为“基本工资统计”。要执行此VBA,请按下Alt + F11打开Visual Basic Editor,然后在左侧的“项目资源管理器”窗格中选择要更改的工作簿。然后,单击“插入”菜单上的“模块”,并将代码复制到新模块经过多次尝试,最后通过chatgpt完成最终效果:提示词:“写VBA程序,其中C列为基础工资,统计基础工资的范围,基础工资的数据是C2到C17的数据,在当前工作区生成柱状图。同时划分为3个区间,区间范围为基础工资在5000到10000,10000到15000,15000以上,注意不能更改任何数据” 英语提示词:
Write VBA program, in which C lists the base salary, statistics the range of the base salary, the basic salary data is C2 to C17 data, in the current work area to generate a bar chart. At the same time, it is divided into three intervals, which range from 5000 to 10,000 to 15000 and above. Note that no data can be changed.我将汉语翻译成英文提示,据说汉语提问比较容易被封账号,最后效果如下:
 最终效果
最终效果
Sub GenerateSalaryChart()
    'Declare variables
    Dim wb As Workbook
    Dim ws As Worksheet
    Dim salaryRange As Range
    Dim salaryData As Variant
    Dim lowRange As Long
    Dim medRange As Long
    Dim highRange As Long
    Dim salaryCount(2) As Integer
    Dim i As Long

    'Set the workbook and worksheet
    Set wb = ThisWorkbook
    Set ws = wb.ActiveSheet

    'Set the salary range
    Set salaryRange = ws.Range("C2:C17")
    salaryData = salaryRange.Value

    'Set the intervals
    lowRange = 5000
    medRange = 10000
    highRange = 15000

    'Loop through the data and count the number of salaries in each interval
    For i = LBound(salaryData) To UBound(salaryData)
        If salaryData(i, 1) >= lowRange And salaryData(i, 1) <= medRange Then
            salaryCount(0) = salaryCount(0) + 1
        ElseIf salaryData(i, 1) > medRange And salaryData(i, 1) <= highRange Then
            salaryCount(1) = salaryCount(1) + 1
        ElseIf salaryData(i, 1) > highRange Then
            salaryCount(2) = salaryCount(2) + 1
        End If
    Next i

    'Create a new chart and set the chart type to column chart
    Dim chartObj As ChartObject
    Set chartObj = ws.ChartObjects.Add(Left:=250, Width:=400, Top:=10, Height:=250)
    chartObj.Chart.ChartType = xlColumnClustered

    'Set the chart title
    chartObj.Chart.HasTitle = True
    chartObj.Chart.ChartTitle.Text = "Basic Wage Statistics"

    'Add the data series to the chart
    Dim chartSeries As Series
    Set chartSeries = chartObj.Chart.SeriesCollection.NewSeries
    chartSeries.Name = "Salary"
    chartSeries.Values = salaryCount

    'Set the axis labels and tick marks
    With chartObj.Chart.Axes(xlCategory, xlPrimary)
        .CategoryNames = Array("5000-10000", "10000-15000", ">15000")
        .TickLabels.NumberFormat = "0"
    End With
End Sub
六 总结
通过上面的一系列例子,感觉提示词非常关键,如果问的方法不对,不够准确,给你提供的答案很可能有问题,既要表达清晰,又要简洁,也许我用的是chatgpt的普通版本,plus版本也许更强大。
对于chatgpt来说,应用范围越来越广,在知识星球中和极客时间中也看到了不同的玩法,比如生成思维导图、总结文档、根据你提供的信息来完成问题的回答,以及这篇介绍的处理Excel数据,越来越多的见识到chatgpt的强大,更可怕的是它还在一直进化之中,打不过就加入,逐步熟练掌握chatgpt的人将成为效率十倍的工作者,再加上点好思路,利用chatgpt做一波创业应该也不错的。


