echarts 柱状图嵌套图表
我们在项目中关于统计类的经常会用到图表一类的展示,一般情况我们直接在echarts找个例子 直接引入便可以直接渲染了。
但是有些时候产品或者交互觉得那些个不好看,想要点别的,所以就要我们去基于echarts去画一下好看的图表。
这次呢是一组数据希望嵌套展示,并且附带着走势图。
先来看看在vue里面如何引入echarts把。
首先npm install echasrts 安装一下
1、然后可以在main.js里面全局引入import echarts from 'echarts' ,引入之后挂在一下 Vue.prototype.$echarts = echarts;
2、组件里面局部使用,直接在组件引入就可以了 import echarts from 'echarts';
3、一般情况下我们可能要封装echasrts组件,所以在js文件里引入的时候可以这样写
let echarts = require('echarts'); let mychart = echarts.init(this.$refs.guangdong_map)
多说一句,如果echarts版本是5.x.x 引入方式就要改变成 import * as echarts from "echarts";
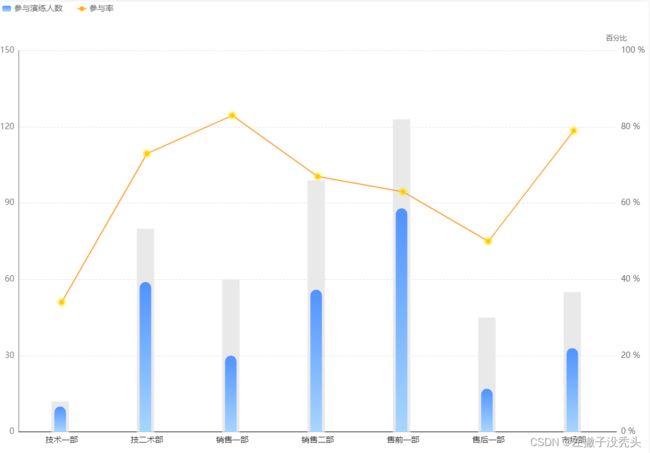
初始效果图

初始代码如下,但是很多时候交互为了让图标看起来更好看一些,所以我们需要做一些调整
option = {
backgroundColor: '#fff',
tooltip: {
show:true,
trigger: 'item',
backgroundColor: 'rgba(255,255,255,0.5)',
axisPointer: {
lineStyle: {
color: {
type: 'linear',
x: 0,
y: 0,
x2: 0,
y2: 1,
colorStops: [{
offset: 0,
color: '#A7D6FF'
}, {
offset: 0.5,
color: '#fff',
}, {
offset: 1,
color: '#A7D6FF'
}],
global: false
}
},
}
},
legend: {
data: ['参与演练人数', '部门总人数 ', '参与率'],
left: '0%',
top:'0%',
bottom:'2%',
textStyle: {
color: "#666666",
fontSize:14,
},
itemWidth: 15,
itemHeight: 10,
itemGap: 25
},
grid: {
top: '10%',
left: '3%',
right: '5%',
bottom: '12%',
},
xAxis: [
{
type: 'category',
data: ['技术一部', '技二术部', '销售一部', '销售二部', '售前一部', '售后一部', '市场部', '平台部', '测试部', '运维部' ] ,
axisTick: {
show: false // 是否显示坐标轴轴线
},
axisLabel: {
color: '#282828',
fontSize:14,
},
splitLine: {
show: false
},
boundaryGap: true,
axisLine: { //坐标轴轴线相关设置。
show: true,
inside: false,
lineStyle: {
color: '#000'
}
}
},
],
yAxis: [
{
type: 'value',
min: 0,
splitNumber: 4,
splitLine: {show: true},
axisLabel: { //坐标轴刻度标签的相关设置。
show: true,
textStyle: {
color: '#737373',
fontSize:14,
}
},
axisLine: {
show: true,
},
axisTick: {
show: false,
},
splitLine: {
lineStyle: {
color: 'rgba(131,101,101,0.2)',
type: 'dashed',
}
},
show: true,
},
{
type: "value",
name: "百分比",
nameTextStyle: {
color: "#666666"
},
position: "right",
axisLine: {
lineStyle: {
color: '#cdd5e2'
}
},
splitLine: {
show: false,
},
axisLabel: {
show: true,
formatter: "{value} %", //右侧Y轴文字显示
textStyle: {
color: "#666666",
fontSize:14,
}
}
}
],
dataZoom: [
{
show: true,
realtime: true,
"height": 12,
start: 0,
end: 70,
bottom:'2%',
},
{
type: 'inside',
realtime: true,
"height": 12,
start: 0,
end: 70
}
],
series: [
{
name: '参与演练人数',
type: 'bar',
barMaxWidth: 20,
zlevel: 10,
// barGap: '100%',
data: [10, 59, 30,56, 88, 17,33, 55,2,40, 23, 50],
itemStyle: {
normal: {
color: {
type: 'linear',
x: 0,
y: 0,
x2: 0,
y2: 1,
colorStops: [{
offset: 0,
color: '#4F93FE'
}, {
offset: 1,
color: '#A7D6FF'
}]
},
barBorderRadius: [30, 30, 0, 0],
}
},
},
{
name: '部门总人数',
type: 'bar',
itemStyle: {
normal: {
color: '#E9E9E9',
}
},
silent: true,
barWidth: 30,
barGap: '-125%',
data: [12, 80, 60,99, 123, 45, 55,68, 67, 100,70, 40, 60]
},
{
name: "参与率",
type: "line",
yAxisIndex: 1, //使用的 y 轴的 index,在单个图表实例中存在多个 y轴的时候有用
smooth: false, //平滑曲线显示
symbol: "circle", //标记的图形为实心圆
symbolSize: 8, //标记的大小
itemStyle: {
normal: {
color: '#ffa43a',
borderColor: 'rgba(255, 234, 0, 0.5)', //圆点透明 边框
borderWidth: 7
},
},
lineStyle: {
color: "#ffa43a"
},
data: [34, 73, 83, 67, 63, 50, 79,100,50,58,58,84]
}
]
};
修改之后的效果如如下

基本上我们是可以修改一些颜色,布局,字体大小,包括lable的显示等等
legend: {
    data: ['参与演练人数', '部门总人数', '参与率'], //图例要显示的文字
    y: '0%',//图例的位置
    left: '0%',//图例的位置
    itemHeight: 12, //调整图例块的高
    itemWidth: 12,//调整图例块的宽
  },
![]()
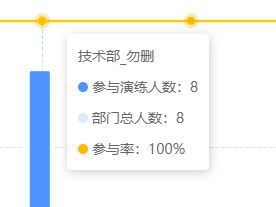
自定义tooltip的样式和显示,在formatter里面写,同时也要注意trigger不同的值,拿到的数据也不一样
tooltip: {
    trigger: 'axis',
    formatter: function(params) {
      var showTip = ""
        showTip = `
        ${params[0].name}<br>
        <div style="margin-top:10px;">${params[0].marker}${params[0].seriesName}:${params[0].value}</div>
        <div style="margin-top:10px;">${params[1].marker}${params[1].seriesName}:${params[1].value}</div>
        <div style="margin-top:10px;">${params[2].marker}${params[2].seriesName}:${params[2].value}%</div>
        `
      return showTip
    }
  },

实现嵌套的关键 ,设置柱子的宽度,然后将要放到后面的柱子设置barGap为负值,这个在官网上也是有详细解释的

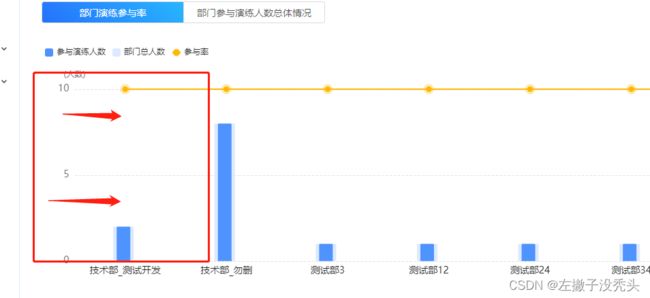
双轴中有个东西经常会出现的就是,坐标轴可能会显示小数,比如说左侧的人数,最大值是2,分成4列就会出现0.5的情况,所以交互也要解决掉

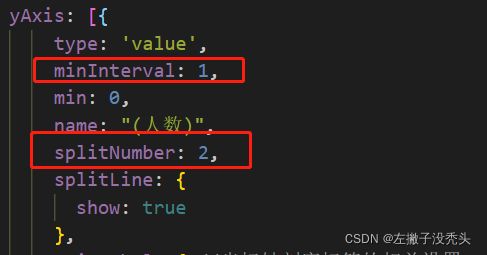
splitNumber 这个设置的值决定于你将坐标的块分成几份,也就是这样的
minInterval 这个属性自动计算的坐标轴最小间隔大小,设置成1的时候后表示整数分隔,注意:只在数值轴或时间轴中(type: ‘value’ 或 ‘time’)有效