机器学习实战5-天气预测系列:利用数据集可视化分析数据,并预测某个城市的天气情况
大家好,我是微学AI,最近天气真的是多变啊,忽冷忽热,今天再次给大家带来天气的话题,机器学习实战5-天气预测系列,我们将探讨一个城市的气象数据集,并利用机器学习来预测该城市的天气状况。该数据集包含年平均温度和湿度等信息。
一、准备工作
首先,我们需要了解一下数据集中包含哪些信息。原始数据集可能包含多个变量,但我们主要关注年平均温度和湿度这两个因素对天气状况的影响。年平均温度和湿度可以很好地反映该城市的气候状况,因此它们是预测天气状况的重要变量。我们会对数据集中的各种字段进行分析。
在数据预处理和分析完成之后,我们可以使用各种机器学习算法进行预测。这些算法可以分为有监督学习和无监督学习。有监督学习算法需要使用标记数据集进行训练,以生成预测模型。常用的有监督学习算法包括线性回归、决策树、随机森林、向量机分类模型(SVC算法)等。无监督学习算法则不需要标记数据集,而是通过发现数据集中的潜在规律进行预测。常用的无监督学习算法包括聚类、降维等。本文采用向量机分类模型进行分类预测。
二、代码实践
1.数据导入
import pandas as pd

import matplotlib.pyplot as plt
import seaborn as sns
plt.rcParams['font.sans-serif']=['SimHei']

df = pd.read_csv('weather_dataset.csv')
labels = pd.read_csv('weather_labels.csv')
我们将导入数据,数据的获取链接:https://pan.baidu.com/s/17M4oR-G_HVcDfFq1ap2rqw?pwd=9iu1
提取码:9iu1
数据样例:
| DATE | MONTH | BASEL_cloud_cover | BASEL_humidity | BASEL_pressure | BASEL_global_radiation | BASEL_precipitation | BASEL_sunshine | BASEL_temp_mean | BASEL_temp_min | BASEL_temp_max | BUDAPEST_cloud_cover | BUDAPEST_humidity | BUDAPEST_pressure |
| 20000101 | 1 | 8 | 0.89 | 1.0286 | 0.2 | 0.03 | 0 | 2.9 | 1.6 | 3.9 | 3 | 0.92 | 1.0268 |
| 20000102 | 1 | 8 | 0.87 | 1.0318 | 0.25 | 0 | 0 | 3.6 | 2.7 | 4.8 | 8 | 0.94 | 1.0297 |
| 20000103 | 1 | 5 | 0.81 | 1.0314 | 0.5 | 0 | 3.7 | 2.2 | 0.1 | 4.8 | 6 | 0.95 | 1.0295 |
| 20000104 | 1 | 7 | 0.79 | 1.0262 | 0.63 | 0.35 | 6.9 | 3.9 | 0.5 | 7.5 | 8 | 0.94 | 1.0252 |
| 20000105 | 1 | 5 | 0.9 | 1.0246 | 0.51 | 0.07 | 3.7 | 6 | 3.8 | 8.6 | 5 | 0.88 | 1.0235 |
| 20000106 | 1 | 3 | 0.85 | 1.0244 | 0.56 | 0 | 5.7 | 4.2 | 1.9 | 6.9 | 5 | 0.89 | 1.026 |
| 20000107 | 1 | 8 | 0.84 | 1.0267 | 0.2 | 0 | 0 | 4.7 | 1.8 | 6.2 | 8 | 1 | 1.0299 |
| 20000108 | 1 | 4 | 0.79 | 1.0248 | 0.54 | 0 | 4.3 | 5.6 | 4.1 | 8.4 | 8 | 0.97 | 1.0302 |
| 20000109 | 1 | 8 | 0.88 | 1.0243 | 0.11 | 0.65 | 0 | 4.6 | 3.8 | 5.7 | 8 | 0.95 | 1.0289 |
| 20000110 | 1 | 8 | 0.91 | 1.0337 | 0.06 | 0.09 | 0 | 2.4 | 1.4 | 3.8 | 6 | 0.89 | 1.0323 |
| 20000111 | 1 | 8 | 0.88 | 1.0373 | 0.06 | 0 | 0 | 3.2 | 2.6 | 3.9 | 7 | 0.86 | 1.0381 |
| 20000112 | 1 | 8 | 0.77 | 1.0319 | 0.1 | 0 | 0 | 2.4 | 0.8 | 3 | 6 | 0.78 | 1.0378 |
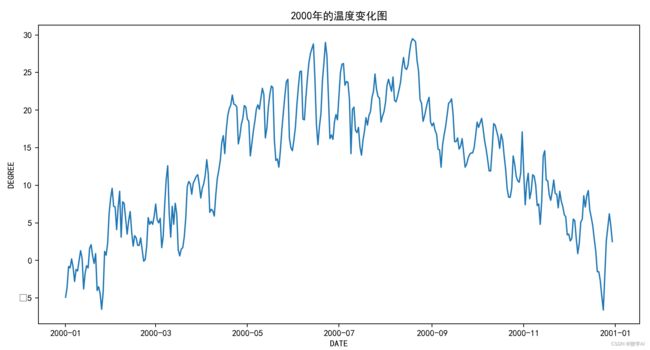
2.2000年的温度变化图
f_budapest = pd.concat([df.iloc[:,:2],df.iloc[:,11:19]],axis=1)
df_budapest['DATE'] = pd.to_datetime(df_budapest['DATE'],format='%Y%m%d')

def mean_for_mth(feature):
    mean = []
    for x in range(12):
        mean.append(
            float("{:.2f}".format(df_budapest[df_budapest['MONTH'] == (x+1)][feature].mean())))
    return mean

df_budapest.drop(['MONTH'],axis=1).describe()

#sns.set(style="darkgrid")
plt.figure(figsize=(12,6))
plt.plot(df_budapest['DATE'][:365],df_budapest['BUDAPEST_temp_mean'][:365])
plt.title('2000年的温度变化图')
plt.xlabel('DATE')
plt.ylabel('DEGREE')

plt.show()3.布达佩斯(匈牙利首都)年平均温度
months = ['Jan', 'Febr', 'Mar', 'Apr', 'May', 'Jun', 'Jul',
          'Aug', 'Sep', 'Oct', 'Nov', 'Dec']
mean_temp = mean_for_mth('BUDAPEST_temp_mean')

plt.figure(figsize=(12,6))
bar = plt.bar(x = months,height = mean_temp, width = 0.8, color=['thistle','mediumaquamarine',                'orange'])
plt.xticks(rotation = 45)
plt.xlabel('MONTHS')
plt.ylabel('DEGREES')
plt.title('布达佩斯(匈牙利首都)年平均温度')
plt.bar_label(bar)
plt.show()4.布达佩斯(匈牙利首都)的年平均湿度
mean_temp = mean_for_mth('BUDAPEST_humidity')
plt.figure(figsize=(12,6))
bar = plt.bar(x = months, height = mean_temp, width = 0.8, color=['thistle','mediumaquamarine',                'orange'])
plt.xticks(rotation = 45)
plt.xlabel('MONTHS')
plt.ylabel('HUMIDITY')
plt.title('布达佩斯(匈牙利首都)的年平均湿度')
plt.bar_label(bar)
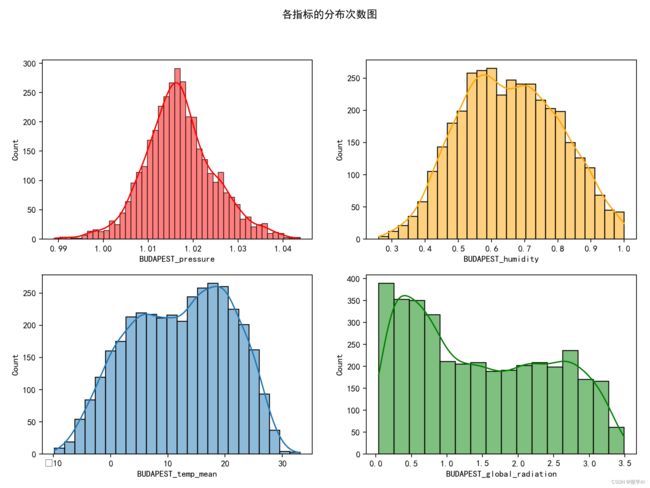
plt.show()5.各指标的分布次数图
fig, axs = plt.subplots(2, 2, figsize=(12,8))
fig.suptitle('各指标的分布次数图')
sns.histplot(data = df_budapest, x ='BUDAPEST_pressure', ax=axs[0,0], color='red', kde=True)
sns.histplot(data = df_budapest, x ='BUDAPEST_humidity', ax=axs[0,1], color='orange', kde=True)
sns.histplot(data = df_budapest, x ='BUDAPEST_temp_mean', ax=axs[1,0], kde=True)
sns.histplot(data = df_budapest, x ='BUDAPEST_global_radiation', ax=axs[1,1], color='green', kde=True)
plt.show()6. 分析天气标签提供一些基本的数据探索和采样策略
针对数据进行了一些数据探索和取样,具体包括以下步骤:
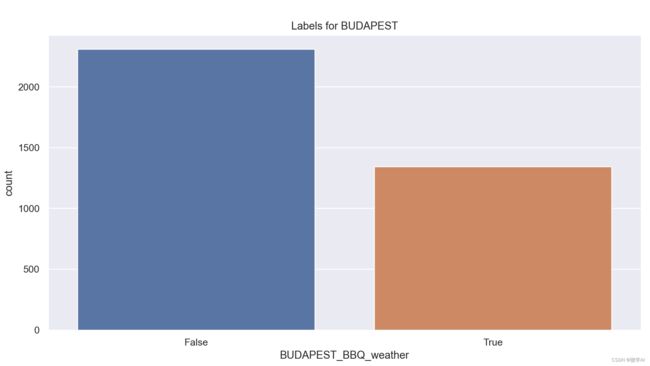
1.统计 天气标签(labels)的数量分布并使用 seaborn 绘制了计数图;
2.计算天气标签(labels)为真和为假的百分比;
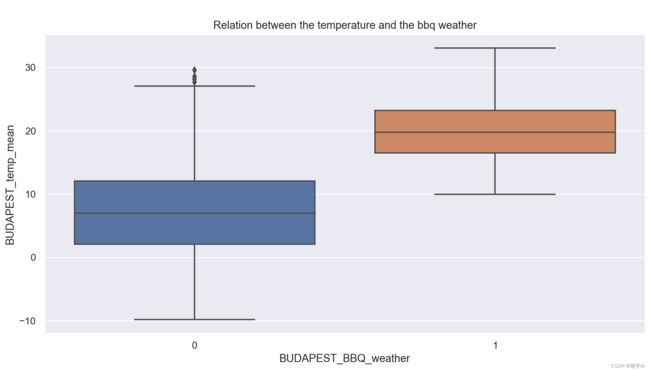
3.将 天气标签转换为整数,并使用 seaborn 绘制了标签(labels)与温度的关系;
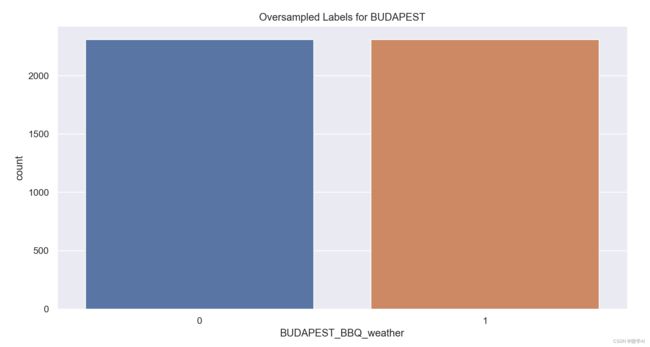
4.统计了过采样后的天气标签(labels)的数量分布并使用 seaborn 绘制了计数图;
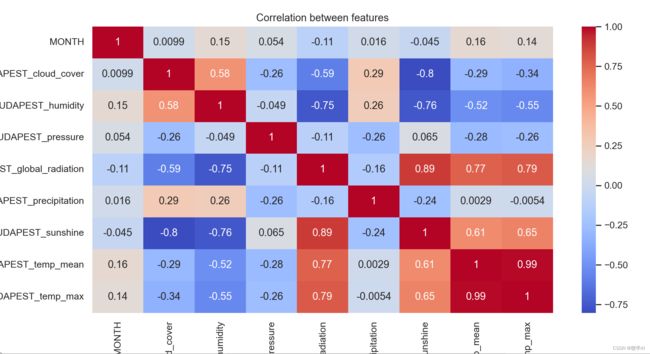
5.绘制了数据集的特征之间的相关性热图。
labels_budapest = labels['BUDAPEST_BBQ_weather']
sns.set(style="darkgrid")
plt.figure(figsize=(12,6))
sns.countplot(x = labels_budapest).set(title='Labels for BUDAPEST')

true_val = len(labels_budapest[labels_budapest == True])
false_val = len(labels_budapest[labels_budapest == False])
print('Precent of True values: {0:.2f}%'.format(true_val/(true_val+false_val)*100))
print('Precent of False values: {0:.2f}%'.format(false_val/(true_val+false_val)*100))


labels_budapest = labels_budapest.astype(int)
plt.figure(figsize=(12,6))
sns.set(style="darkgrid")
sns.boxplot(y = df_budapest['BUDAPEST_temp_mean'], x = labels_budapest).set(title='Relation between the temperature and the bbq weather')

labels_budapest = labels_budapest.astype(int)
df_budapest = df_budapest.drop(['DATE'],axis=1)
from imblearn.over_sampling import RandomOverSampler
oversample = RandomOverSampler()
ovrspl_X, ovrspl_y  = oversample.fit_resample(df_budapest, labels_budapest)

labels_budapest = labels['BUDAPEST_BBQ_weather']
sns.set(style="darkgrid")
plt.figure(figsize=(12,6))
sns.countplot(x = ovrspl_y).set(title='Oversampled Labels for BUDAPEST')

true_val = len(ovrspl_y[ovrspl_y == 1])
false_val = len(ovrspl_y[ovrspl_y == 0])
print('Precent of True values: {0:.1f}%'.format(true_val/(true_val+false_val)*100))
print('Precent of False values: {0:.1f}%'.format(false_val/(true_val+false_val)*100))

plt.figure(figsize=(12,6))
sns.set(style="darkgrid")
sns.heatmap(df_budapest.corr(),annot=True,cmap='coolwarm').set(title='Correlation between features')
plt.show()
7. 基于SVC模型的机器学习预测天气分类
from sklearn.preprocessing import MinMaxScaler

scaler = MinMaxScaler()
norm_X = scaler.fit_transform(ovrspl_X)
norm_X = pd.DataFrame(norm_X, columns=df_budapest.columns)
norm_X.describe()

from sklearn.model_selection import train_test_split
# Splitting dataset on training and testing datasets
X_train, X_test, y_train, y_test = train_test_split(ovrspl_X,ovrspl_y, test_size = 0.3, random_state = 42)
print('Training set: ' + str(len(X_train)))
print('Testing set: ' + str(len(X_test)))

from sklearn.svm import SVC

model = SVC(verbose=True, kernel = 'linear', random_state = 0)
model.fit(X_train,y_train)

y_predict = model.predict(X_test)
from sklearn.metrics import classification_report, confusion_matrix, accuracy_score
print('Classification report--------------------------------')
print(classification_report(y_test,y_predict))
sns.heatmap(confusion_matrix(y_test,y_predict), annot=True, fmt='g').set(title='Confusion Matrix')

print('Model accuracy is: {0:.2f}%'.format(accuracy_score(y_test, y_predict)*100))
运行结果:
Training set: 3235
Testing set: 1387
[LibSVM]................................*...............................*................................................*
optimization finished, #iter = 110434
obj = -581.485644, rho = -4.010761
nSV = 647, nBSV = 635
Total nSV = 647
Classification report--------------------------------
              precision    recall  f1-score   support

           0       0.98      0.91      0.95       712
           1       0.92      0.98      0.95       675

    accuracy                           0.95      1387
   macro avg       0.95      0.95      0.95      1387
weighted avg       0.95      0.95      0.95      1387

Model accuracy is: 94.66%
文章结束,欢迎大家咨询与合作。

