【Leafletjs】3.拖拽添加marker
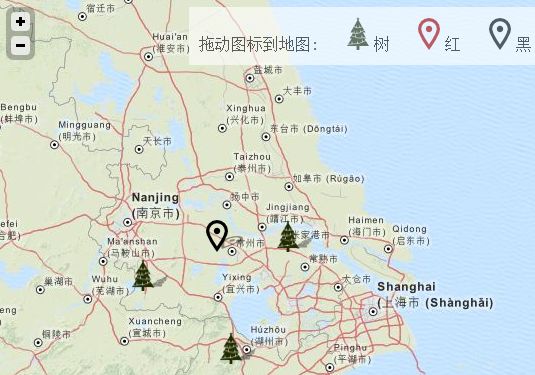
在找leaflet和wfs的相关知识中 看到了这一效果 感觉不错:
这个效果的实现主要使用了JqueryUI的draggable和leaflet的containerPointToLatLng(可由屏幕坐标返回地理坐标)方法
// Drag & Drop

    $(".drag").draggable({

    helper: 'clone',

    containment: 'map',

    start: function(evt, ui) {

    $('#box').fadeTo('fast', 0.6, function() {});

    },

    stop: function(evt, ui) {

    $('#box').fadeTo('fast', 1.0, function() {});


    var options = {

    pid: guid(),

    type: ui.helper.attr('type'),

    icon: eval(ui.helper.attr('type') + 'Icon'),

    draggable: true

    };


    insertPoint(

    map.containerPointToLatLng([ui.offset.left, ui.offset.top]),

    options

    );

    }

    });
完整代码:

<!DOCTYPE html >

    <html>

    <head>

    <title>Tree Map</title>

    <meta charset="utf-8" />


    <link rel="stylesheet" href="http://cdn.leafletjs.com/leaflet-0.4.5/leaflet.css" />

    <!--[if lte IE 8]>

    <link rel="stylesheet" href="http://cdn.leafletjs.com/leaflet-0.4.5/leaflet.ie.css" />

    <![endif]-->

    <link rel="stylesheet" href="http://code.jquery.com/ui/1.9.2/themes/base/jquery-ui.css" />


    <style>

    * {

    padding: 0;

    margin: 0;

    }


    body,html {

    height: 100%;

    }


    #map {

    width: 100%;

    height: 100%;

    min-height: 100%;

    }


    * html #map {

    height: 100%;

    }


    #box {

    position: absolute;

    top: 10px;

    right: 10px;

    background-color: white;

    padding: 10px;

    z-index: 1000;

    }


    #box img {

    margin-left: 20px;

    margin-right: 5px;

    cursor: pointer;

    }

    </style>

    </head>

    <body>

    <div id="map"></div>

    <div id="box">拖动图标到地图:

    <span class="poi-type"><img class="drag" type="tree" src="icons/tree_green.png" alt="树: 绿色" />树</span>

    <span class="poi-type"><img class="drag" type="red" src="icons/poi_red.png" alt="兴趣点: 红" />红</span>

    <span class="poi-type"><img class="drag" type="black" src="icons/poi_black.png" alt="兴趣点: 黑" />黑</span>

    </div>


    <script src="http://cdn.leafletjs.com/leaflet-0.4.5/leaflet.js"></script>

    <script src="http://code.jquery.com/jquery-1.8.3.min.js"></script>

    <script src="http://code.jquery.com/ui/1.9.2/jquery-ui.js"></script>


    <script>


    // Configure map

    var map, user;

    var markers = [];


    var poiIcon = L.Icon.extend({

    options: {

    iconSize: [22,32],

    iconAnchor: [11,16],

    shadowUrl: 'icons/poi_shadow.png',

    shadowSize: [22,13],

    shadowAnchor: [-4,0],

    popupAnchor: [32,-2]

    }

    });


    var blackIcon = new poiIcon({iconUrl:'icons/poi_black.png'});

    var redIcon = new poiIcon({iconUrl:'icons/poi_red.png'});

    var treeIcon = new poiIcon({iconUrl:'icons/tree_green.png',shadowUrl:'icons/tree_shadow.png'});


    // Mapquest layer

    var mapquest = new L.TileLayer('http://otile{s}.mqcdn.com/tiles/1.0.0/osm/{z}/{x}/{y}.png', {

    maxZoom: 18,

    subdomains: ['1','2','3','4']

    });


    // Init application

    $(document).ready(function() {


    map = new L.Map('map', {

    center: new L.LatLng(30.68, 124.18),

    zoom: 6,

    layers: [mapquest],

    zoomControl: true

    });


    // Drag & Drop

    $(".drag").draggable({

    helper: 'clone',

    containment: 'map',

    start: function(evt, ui) {

    $('#box').fadeTo('fast', 0.6, function() {});

    },

    stop: function(evt, ui) {

    $('#box').fadeTo('fast', 1.0, function() {});


    var options = {

    pid: guid(),

    type: ui.helper.attr('type'),

    icon: eval(ui.helper.attr('type') + 'Icon'),

    draggable: true

    };


    insertPoint(

    map.containerPointToLatLng([ui.offset.left, ui.offset.top]),

    options

    );

    }

    });

    });


    // INSERT point

    function insertPoint(position,options) {


    var point = L.marker(position,options).addTo(map);

    point.bindPopup(

    '<a onClick="deletePoint(\'' + point.options.pid

    + '\');" href="#">Remove Me!</a>',

    {

    closeButton: false

    }

    );


    point.on('dragend', function(evt){

    updatePoint(point);

    });


    markers.push(point);

    }


    // DELETE point

    function deletePoint(pid) {


    for(i=0;i<markers.length;i++) {

    if(markers[i].options.pid === pid) {

    map.removeLayer(markers[i]);

    markers.splice(i, 1);

    }

    }


    }


                function S4() {

                        return (((1+Math.random())*0x10000)|0).toString(16).substring(1);

                }

                function guid() {

                        return (S4()+S4()+"-"+S4()+"-"+S4()+"-"+S4()+"-"+S4()+S4()+S4());

                }

    </script>

    </body>

    </html>

demo:http://www.fenglgis.com/examples/leaflet_drag/drag.html
原文地址:http://blog.georepublic.info/2012/leaflet-example-with-wfs-t/
