Developer Dashboard in SharePoint 2010
Problem
Do users complain about SharePoint performance? Prior to SharePoint 2010, tracking down performance bottlenecks might involve attaching a debugger to code and enabling a trace from the SQL Server Profiler. Now, with SharePoint 2010, you can use a cool new feature called Developer Dashboard.
Solution
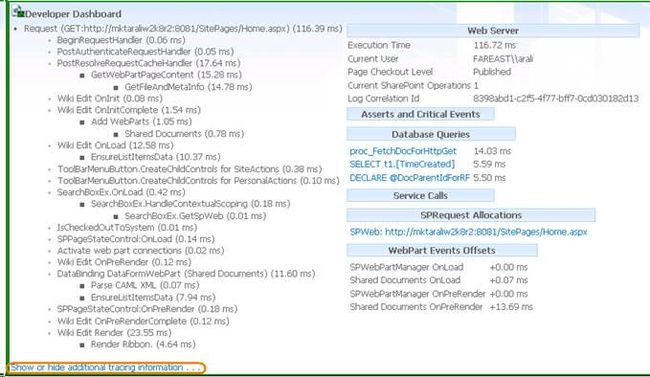
The SharePoint 2010 Developer Dashboard displays tracing and diagnostic information about page rendering and includes information about page components, controls, queries and execution time (an analogy of ASP.NET page tracing).
The Developer Dashboard feature is disabled by default and can be enabled or used on demand either by using STSADM SharePoint Administrative tool or a PowerShell cmdlet or using an API object model. The Unified Logging Service (ULS) logs contain information details about performance issues and resource usage, but analyzing ULS raw data is very difficult and takes time. The Developer Dashboard displays all of this information in a graphical way which makes understanding/troubleshooting quite easier.
The Developer Dashboard works in three different modes.
If you are changing it programmatically, you would use this enumeration : SPDeveloperDashboardLevel), by default it's in OFF mode where it will not capture any tracing information (no debugging information instrumentation).
You can make it capture tracing information On-Demand (allows toggling to capture data or not) or you can put it in ON mode where it will capture all the tracing information all the time. This information is displayed on the bottom of the every page which uses a SharePoint Foundation 2010 master page or a custom master page included with the Dashboard control. You even include Dashboard control on any specific page you want, for detail refer to "Using Developer Dashboard on Custom Master Pages" section on this link.
Enabling/Disabling Developer Dashboard with STSADM
On a SharePoint 2010 installation, STSADM (by default) is in "C:\Program Files\Common Files\Microsoft Shared\web server extensions\14\BIN".
To turn it off (execute either of these two commands)
stsadm -o setproperty -propertyname developer-dashboard -propertyvalue off
To turn it on demand (execute either of these two commands
stsadm -o setproperty -propertyname developer-dashboard -propertyvalue OnDemand
When you enable Developer Dashboard on demand, you will notice a small icon on the top right corner of the page as shown below. Clicking on this icon will put the Developer Dashboard on the bottom section of the page. You can use this icon to toggle ON or OFF the Developer Dashboard.
To turn it on (execute either of these two commands)
stsadm -o setproperty -propertyname developer-dashboard -propertyvalue On
Once you have enabled the Developer Dashboard, you will see similar information as shown below on your pages. This information includes performance counters which measure usage and resource consumption at the stage of the processing request . For example, Execution start time, Thread execution time, URL of the request, SQL statements generated by the request processing, call stack information about each WCF call, etc.. You can click on the link "Show or hide additional tracing information" shown on left bottom corner to display additional tracing information.
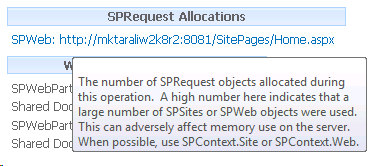
You can hover the mouse over each of the sections and a pop up will display additional information (as below):
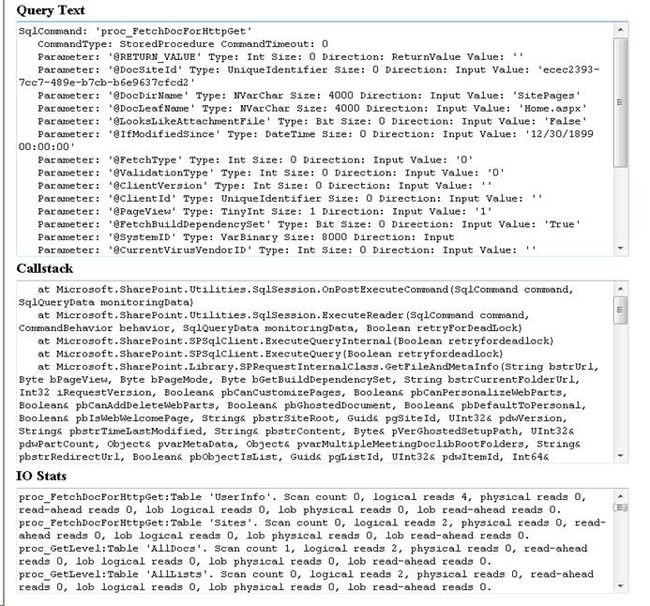
Notice that database calls are hyperlinks. Clicking on this link will give you a complete picture about the SQL Command executed, the numbers of parameters passed and returned, IO stats from SQL and the call stack as you can see below:
Enabling/Disabling Developer Dashboard with PowerShell
Note that the STSADM SharePoint Administrative tool has been deprecated and is being replaced with (more powerful and efficient) PowerShell cmdlets based on the .NET Framework. To launch the SharePoint 2010 PowerShell console, go to:
START -> All Programs -> Microsoft SharePoint 2010 Products -> SharePoint 2010 Management Shell and click on it and execute the respective commands, as shown below, for the kind of operations you want to perform.
- The DisplayLevel property is used to set the Developer Dashboard mode either On, Off or OnDemand.
- The RequiredPermissions property used to specify a permission mask defining the permissions required to see the developer dashboard.
- EmptyMask specifies that all users will be able to access it.
- The TraceEnabled property is used to display a link on the left bottom corner to display full verbose traces.
- The Update method call causes an object to save its state and propagates changes to all the servers of the farm.
- For more details about other properties and methods of SPDeveloperDashboardSettings class click here.
To turn it off
$iDeveloperDashboardSettings.DisplayLevel = 'Off';
$iDeveloperDashboardSettings.RequiredPermissions = 'EmptyMask';
$iDeveloperDashboardSettings.TraceEnabled = $true;
$iDeveloperDashboardSettings.Update();
To turn it on on
$iDeveloperDashboardSettings.DisplayLevel = 'On';
$iDeveloperDashboardSettings.RequiredPermissions = 'EmptyMask';
$iDeveloperDashboardSettings.TraceEnabled = $true;
$iDeveloperDashboardSettings.Update();
To turn it on demand
$iDeveloperDashboardSettings.DisplayLevel = 'OnDemand';
$iDeveloperDashboardSettings.RequiredPermissions = 'EmptyMask';
$iDeveloperDashboardSettings.TraceEnabled = $true;
$iDeveloperDashboardSettings.Update();
Enabling/Disabling Developer Dashboard with Object Model
The STSADM SharePoint Administrative tool and PowerShell cmdlets are not the only ways to enable and disable Developer Dashboard. You can even use the object model to do it programmatically. You can further use the SPMonitoredScope class to extend the various performance counters at various scopes of the code. To learn more about this class click here.
To turn it off
CService.DeveloperDashboardSettings.DisplayLevel = SPDeveloperDashboardLevel.Off;
CService.DeveloperDashboardSettings.Update();
To turn it on
CService.DeveloperDashboardSettings.DisplayLevel = SPDeveloperDashboardLevel.On;
CService.DeveloperDashboardSettings.Update();
To turn it on demand
CService.DeveloperDashboardSettings.DisplayLevel = SPDeveloperDashboardLevel.OnDemand;
CService.DeveloperDashboardSettings.Update();
Note: Jaap Vossers has extended the capability of SharePoint Developer Dashboard to display the information in graphical form (his extension plots an interactive diagram with data from the Developer Dashboard, giving pointers to instantly identify where the bottlenecks are in your code), to learn about this enhancement called "SharePoint 2010 Developer Dashboard Visualizer" and to download it, click here.
Next Steps
- Review Using the Developer Dashboard article on msdn.
- Review SharePoint 2010 Developer Dashboard Visualizer on codeplex.
- Return to MSSharepointTips to read about other topics and ideas.
- Check out MSSQLTips.com for great information about Microsoft SQL Server


