100天精通Python(可视化篇)——第87天:matplotlib绘制不同种类炫酷雷达图参数说明+代码实战(普通、堆叠、多个、矩阵、极坐标雷达图)
文章目录
- 专栏导读
- 1. 雷达图
-
- 1)介绍
- 2)参数说明
- 2. 基本雷达图
- 3. 堆叠雷达图
- 4. 六边形战士
- 5. 多个雷达图
- 6. 雷达图矩阵
- 7. 极坐标雷达图
- 书籍推荐(包邮送书5本)
专栏导读
本文已收录于《100天精通Python从入门到就业》:本专栏专门针对零基础和需要进阶提升的同学所准备的一套完整教学,从0到100的不断进阶深入,后续还有实战项目,轻松应对面试,专栏订阅地址:https://blog.csdn.net/yuan2019035055/category_11466020.html
- 优点:订阅限时9.9付费专栏进入千人全栈VIP答疑群,作者优先解答机会(代码指导、远程服务),群里大佬众多可以抱团取暖(大厂内推机会)
- 专栏福利:简历指导、招聘内推、每周送实体书、80G全栈学习视频、300本IT电子书:Python、Java、前端、大数据、数据库、算法、爬虫、数据分析、机器学习、面试题库等等


1. 雷达图
1)介绍
雷达图(Radar Chart)又称作径向图、多变量图或极坐标图,是表示多维度数据的一种形象化的数据图标,通常由集中的一个中心发出多条等长的连线,沿着指定的方向延伸出等值的点。
特点:
- 雷达图的优点是可以从多角度、多变量来研究和分析构成因素、数据结构;
- 雷达图比较适用于对对象某一数据方面在各个维度之间存在关系情况下的表示;
- 雷达图还可以表示多组数据之间的对比;
应用场景:
- 雷达图更适用于表示一组数据中不同类别或特征之间存在相互关联性;
- 能够很好的表达多个数据之间关系;
- 适用于分析数据对比,比如多人职业行为的对比,多个公司的工作效率的对比,用来把多个变量的数据比较起来。
2)参数说明
plt.polar函数是matplotlib中用于绘制极坐标图的函数,可以用于绘制雷达图:
def polar(*args, **kwargs):
    """
    Make a polar plot.

    call signature::

      polar(theta, r, **kwargs)

    Multiple *theta*, *r* arguments are supported, with format strings, as in
    `plot`.
    """
    # If an axis already exists, check if it has a polar projection
    if gcf().get_axes():
        ax = gca()
        if not isinstance(ax, PolarAxes):
            _api.warn_external('Trying to create polar plot on an Axes '
                               'that does not have a polar projection.')
    else:
        ax = axes(projection="polar")
    return ax.plot(*args, **kwargs)
参数大全及其说明:
- theta:极坐标系中的角度,以弧度表示。
- r:极坐标系中的半径,表示数据的大小。
- c:数据点的颜色。
- linewidth:数据点的线宽。
- linestyle:数据点的线型。
- marker:数据点的标记类型。
- alpha:数据点的透明度。
- label:数据点的标签,用于添加图例。
- **kwargs:其他参数。
其中,theta和r是必须的参数,其他参数都是可选的。你可以根据自己的需要选择适当的参数,以创建自己的雷达图。
2. 基本雷达图
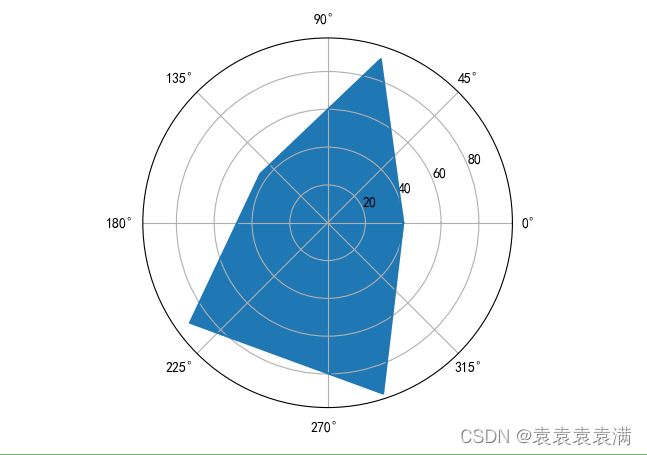
案例1:
import matplotlib.pyplot as plt
import numpy as np

# 定义属性和属性值
properties = ['输出','KDA','发育','团战','生存']
values = [40,91,44,90,95,40]

# 生成角度
theta = np.linspace(0,2*np.pi,6)

# 绘制雷达图
plt.polar(theta,values)  # 绘制折线图
plt.fill(theta,values)   # 填充多边形区域

# 显示图形
plt.show()
代码说明:
导入matplotlib.pyplot和numpy库。

定义属性和属性值,properties为变量名称,values为对应的数值。

生成角度,使用numpy库中的np.linspace函数生成从0到2π的等分角度,6表示等分的份数。

绘制雷达图,使用plt.polar函数绘制折线图,使用plt.fill函数填充多边形区域。

显示图形,使用plt.show函数显示图形。
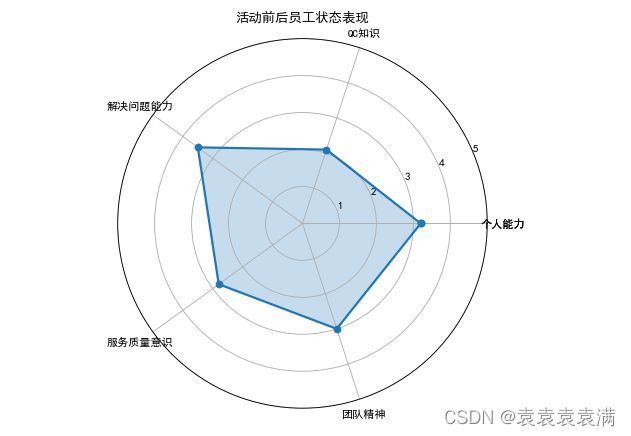
案例2:
# 导入第三方模块
import numpy as np
import matplotlib.pyplot as plt

# 设置中文为雅黑
plt.rcParams['font.sans-serif'] = ['SimHei']

# 构造数据
values = np.array([3.2,2.1,3.5,2.8,3])
feature = np.array(['个人能力','QC知识','解决问题能力','服务质量意识','团队精神'])
N = len(values)

# 设置雷达图的角度,用于平分切开一个圆面
angles=np.linspace(0,2*np.pi,N, endpoint=False)

# 将折线图形进行封闭操作
values = np.concatenate((values, [values[0]]))
angles = np.concatenate((angles, [angles[0]]))
feature=np.concatenate((feature,[feature[0]]))

# 创建图形
fig=plt.figure(figsize=(10,6),dpi=80)

# 这里一定要设置为极坐标格式
ax = fig.add_subplot(111, polar=True)

# 绘制折线图
ax.plot(angles, values, 'o-', linewidth=2)

# 填充颜色
ax.fill(angles, values, alpha=0.25)

# 添加每个特征的标签
ax.set_thetagrids(angles*180/np.pi, feature)

# 设置雷达图的范围
ax.set_ylim(0,5)

# 添加标题
plt.title('活动前后员工状态表现')

# 添加网格线
ax.grid(True)

# 显示图形
plt.show()
3. 堆叠雷达图
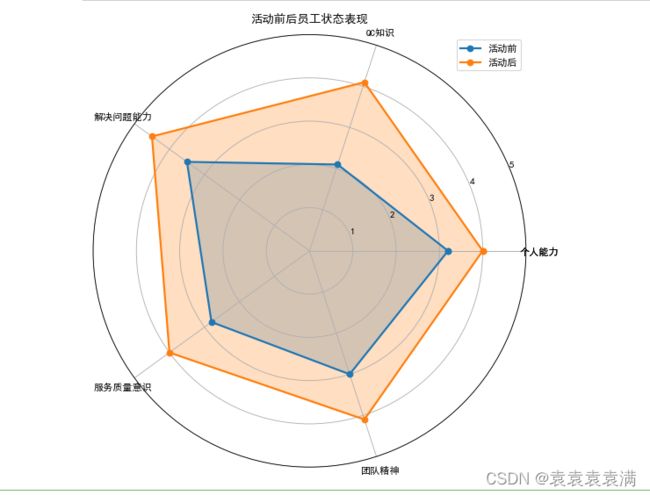
将多个数据集叠加在一起,用于比较多个对象在多个变量上的表现。
# 导入第三方模块
import numpy as np
import matplotlib.pyplot as plt

# 设置中文 雅黑
plt.rcParams['font.sans-serif'] = ['SimHei']

# 构造数据
values = [3.2,2.1,3.5,2.8,3]
values2 = [4,4.1,4.5,4,4.1]
feature = ['个人能力','QC知识','解决问题能力','服务质量意识','团队精神']

N = len(values)

# 设置雷达图的角度,用于平分切开一个圆面
angles=np.linspace(0, 2*np.pi, N, endpoint=False)

# 将雷达图中的折线图封闭
values=np.concatenate((values,[values[0]]))
values2=np.concatenate((values2,[values2[0]]))
angles=np.concatenate((angles,[angles[0]]))
feature=np.concatenate((feature,[feature[0]]))

# 绘图
fig=plt.figure(figsize=(20,8),dpi=80)
ax = fig.add_subplot(111, polar=True)

# 绘制折线图
ax.plot(angles, values, 'o-', linewidth=2, label = '活动前')

# 填充颜色
ax.fill(angles, values, alpha=0.25)

# 绘制第二条折线图
ax.plot(angles, values2, 'o-', linewidth=2, label = '活动后')
ax.fill(angles, values2, alpha=0.25)

# 添加每个特征的标签
ax.set_thetagrids(angles*180/np.pi, feature)

# 设置雷达图的范围
ax.set_ylim(0,5)

# 添加标题
plt.title('活动前后员工状态表现')

# 添加网格线
ax.grid(True)

# 设置图例
plt.legend(loc = 'best')

# 显示图形
plt.show()
该代码实现了一个雷达图,用于比较活动前后员工的状态表现。具体实现步骤如下:
导入需要的第三方模块numpy和matplotlib.pyplot。

设置中文字体为“SimHei”。

构造数据:values表示活动前员工的状态表现,values2表示活动后员工的状态表现,feature表示不同的特征(个人能力、QC知识、解决问题能力、服务质量意识、团队精神)。

设置雷达图的角度,用于平分切开一个圆面。

将雷达图中的折线图封闭,使其形成一个多边形。

绘制折线图和填充颜色,表示活动前和活动后员工的状态表现。

添加每个特征的标签,使其能够在雷达图上显示。

设置雷达图的范围,使其能够适配不同的数据。

添加标题,使其能够表达图表的主要意图。

添加网格线,使其能够更好地展示数据。

设置图例,使其能够说明不同的折线图代表的含义。

显示图形,使其能够在屏幕上显示。
运行结果:
4. 六边形战士
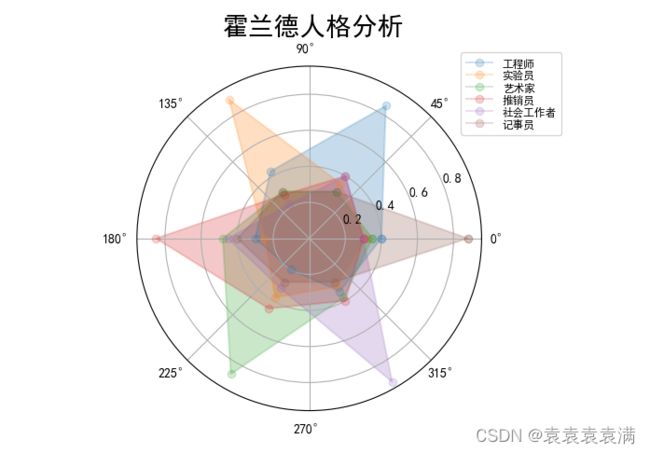
六个堆叠雷达图:
import matplotlib
import matplotlib.pyplot as plt
import numpy as np

#为了正确显示中文字体,将字体更改为黑体‘SimHei’
matplotlib.rcParams['font.family']='SimHei'
matplotlib.rcParams['font.sans-serif']=['SimHei']

data_labels=np.array(['工程师','实验员','艺术家','推销员','社会工作者','记事员'])
n=6
radar_labels=np.array(['    研究型(I)','艺术型(A)','社会型(S)',\
                     '企业型(E)   ','常规型(C)','现实型(R)'])    #  为了美观加了几个空格

# 6种职业数据,列表元素为列表
data=np.array([[0.40,0.32,0.35,0.30,0.30,0.88],
              [0.85,0.35,0.30,0.40,0.40,0.30],
              [0.43,0.89,0.30,0.28,0.22,0.30],
              [0.30,0.25,0.48,0.85,0.45,0.40],
              [0.20,0.38,0.87,0.45,0.32,0.28],
              [0.34,0.31,0.38,0.40,0.92,0.28]])

# 将360度平均分为n个部分(有endpoint=False分为6个部分,反之5个部分)
angles=np.linspace(0,2*np.pi,n,endpoint=False)
data=np.concatenate((data,[data[0]]))
angles=np.concatenate((angles,[angles[0]]))

# 绘制全局绘图区域
plt.figure(facecolor='white')

# 绘制一个1行1列极坐标系子图,当前位置为1
plt.subplot(111,polar=True)

# 放置标题 ,ha是horizontalalignment(水平对齐方式)的缩写
plt.figtext(0.52,0.95,'霍兰德人格分析',ha='center',size=20)

# 连线,画出不规则六边形
plt.plot(angles,data,'o-',linewidth=1.5,alpha=0.2)

# 填充,alpha是透明度(自己的实践理解)
plt.fill(angles,data,alpha=0.25)

# 放置图注(右上角)
legend=plt.legend(data_labels,loc=(0.94,0.80),labelspacing=0.1)
plt.setp(legend.get_texts(),fontsize='small')

# 打开坐标网格
plt.grid(True)

# 显示
plt.show()
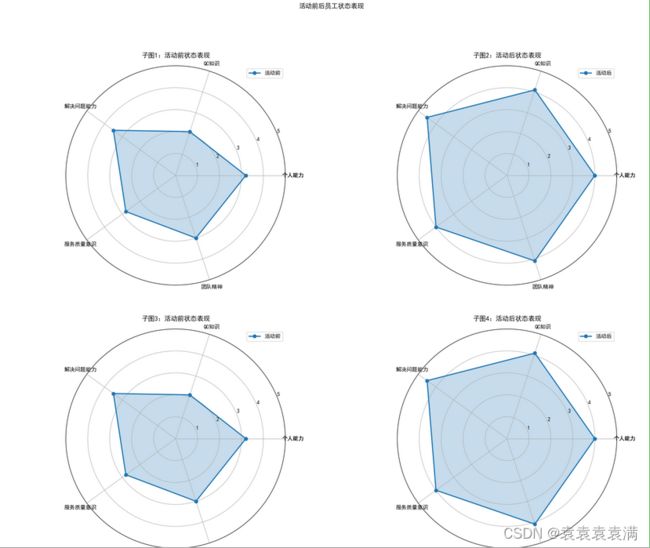
5. 多个雷达图
将多个雷达图放在同一张图中,用于比较多个对象的表现:
# 导入第三方模块
import numpy as np
import matplotlib.pyplot as plt

# 设置中文 雅黑
plt.rcParams['font.sans-serif'] = ['SimHei']

# 构造数据
values = [3.2,2.1,3.5,2.8,3]
values2 = [4,4.1,4.5,4,4.1]
feature = ['个人能力','QC知识','解决问题能力','服务质量意识','团队精神']

N = len(values)

# 设置雷达图的角度,用于平分切开一个圆面
angles=np.linspace(0, 2*np.pi, N, endpoint=False)

# 将雷达图中的折线图封闭
values=np.concatenate((values,[values[0]]))
values2=np.concatenate((values2,[values2[0]]))
angles=np.concatenate((angles,[angles[0]]))
feature=np.concatenate((feature,[feature[0]]))

# 设置子图的排列方式
fig, axs = plt.subplots(2, 2, figsize=(20, 16), subplot_kw=dict(projection='polar'))

# 绘制子图1
axs[0, 0].plot(angles, values, 'o-', linewidth=2, label = '活动前')
axs[0, 0].fill(angles, values, alpha=0.25)
axs[0, 0].set_thetagrids(angles*180/np.pi, feature)
axs[0, 0].set_ylim(0,5)
axs[0, 0].set_title('子图1:活动前状态表现')
axs[0, 0].grid(True)
axs[0, 0].legend(loc = 'best')

# 绘制子图2
axs[0, 1].plot(angles, values2, 'o-', linewidth=2, label = '活动后')
axs[0, 1].fill(angles, values2, alpha=0.25)
axs[0, 1].set_thetagrids(angles*180/np.pi, feature)
axs[0, 1].set_ylim(0,5)
axs[0, 1].set_title('子图2:活动后状态表现')
axs[0, 1].grid(True)
axs[0, 1].legend(loc = 'best')

# 绘制子图3
axs[1, 0].plot(angles, values, 'o-', linewidth=2, label = '活动前')
axs[1, 0].fill(angles, values, alpha=0.25)
axs[1, 0].set_thetagrids(angles*180/np.pi, feature)
axs[1, 0].set_ylim(0,5)
axs[1, 0].set_title('子图3:活动前状态表现')
axs[1, 0].grid(True)
axs[1, 0].legend(loc = 'best')

# 绘制子图4
axs[1, 1].plot(angles, values2, 'o-', linewidth=2, label = '活动后')
axs[1, 1].fill(angles, values2, alpha=0.25)
axs[1, 1].set_thetagrids(angles*180/np.pi, feature)
axs[1, 1].set_ylim(0,5)
axs[1, 1].set_title('子图4:活动后状态表现')
axs[1, 1].grid(True)
axs[1, 1].legend(loc = 'best')

# 添加总标题
plt.suptitle('活动前后员工状态表现')

# 显示图形
plt.show()
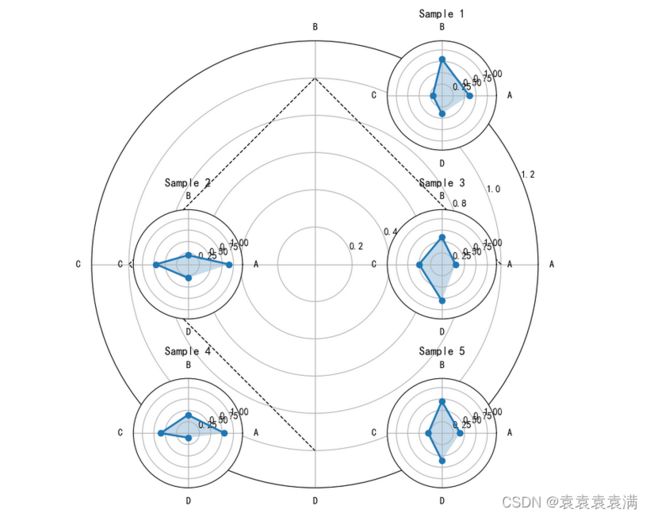
6. 雷达图矩阵
将多个雷达图组成一个矩阵,用于比较多个对象在多个变量上的表现,并可同时比较多个数据集:
import numpy as np
import matplotlib.pyplot as plt

# 数据
data = np.array([
    [0.6, 0.8, 0.2, 0.4],
    [0.9, 0.2, 0.7, 0.3],
    [0.3, 0.6, 0.5, 0.8],
    [0.8, 0.4, 0.6, 0.1],
    [0.4, 0.7, 0.3, 0.6]
])

# 标签
labels = ['A', 'B', 'C', 'D']

# 角度
angles = np.linspace(0, 2*np.pi, len(labels), endpoint=False)

# 添加第一个子图
fig = plt.figure(figsize=(8, 8))
ax = fig.add_subplot(111, polar=True)
ax.plot(angles, [1]*len(angles), 'k--', linewidth=1)  # 画出六边形
ax.set_thetagrids(angles * 180/np.pi, labels)  # 设置极坐标轴的刻度和标签
ax.set_ylim(0, 1.2)  # 设置极坐标轴的极值范围

# 循环添加子图
for i in range(len(data)):
    ax = fig.add_subplot(3, 2, i+2, polar=True)  # 添加子图
    ax.plot(angles, data[i], 'o-', linewidth=2)  # 画出数据点
    ax.fill(angles, data[i], alpha=0.25)  # 填充数据点和中心点之间的区域
    ax.set_thetagrids(angles * 180/np.pi, labels)  # 设置极坐标轴的刻度和标签
    ax.set_ylim(0, 1.2)  # 设置极坐标轴的极值范围
    ax.set_title('Sample {}'.format(i+1))  # 设置子图标题

plt.tight_layout()  # 调整子图的布局
plt.show()  # 显示图形
代码说明:
代码中的data数组存储了每个样本的数据,每一行代表一个样本,每一列代表一种特征。labels数组存储了每个特征的名称。angles数组则是每个特征所对应的角度,用来绘制雷达图的六边形。

首先,使用fig.add_subplot()方法添加第一个子图,用于画出雷达图的六边形,然后设置极坐标轴的刻度和标签,以及极值范围。

接着,循环添加子图,每个子图代表一个样本的雷达图。在每个子图中,使用ax.plot()方法画出数据点,并使用ax.fill()方法填充数据点和中心点之间的区域。然后同样设置极坐标轴的刻度和标签,以及极值范围,并设置子图标题。

最后,使用plt.tight_layout()方法调整子图的布局,以及plt.show()方法显示图形。
7. 极坐标雷达图
import numpy as np
import matplotlib.pyplot as plt
from mpl_toolkits.mplot3d import Axes3D

# 极轴图
plt.figure(figsize=(8,4))
ax1= plt.subplot(111, projection='polar')
ax1.set_title('spot fish')  # 创建标题
ax1.set_rlim(0,12)

data = np.random.randint(1,10,10)
theta=np.arange(0,2*np.pi,2*np.pi/10)

bar = ax1.bar(theta,data,alpha=0.5)
for r,bar in zip(data, bar):
    bar.set_facecolor(plt.cm.jet(r/10.))  # 设置颜色


plt.show()  # 显示图形
代码说明:
导入需要的库:numpy、matplotlib.pyplot、Axes3D(3D图需要)

创建一个极轴图:plt.subplot(111, projection='polar')

设置图形标题:ax1.set_title('spot fish')

设置极轴范围:ax1.set_rlim(0,12)

生成随机数据:data = np.random.randint(1,10,10)

生成极角数据:theta=np.arange(0,2np.pi,2np.pi/10)

绘制柱状图:bar = ax1.bar(theta,data,alpha=0.5)

设置颜色:bar.set_facecolor(plt.cm.jet(r/10.))

显示图形:plt.show()
书籍推荐(包邮送书5本)
《Excel应用大全》
本书全面系统地介绍了 Excel 365 & Excel 2021 的技术特点和应用方法,深入揭示其背后的原理概念,并配合大量典型实用的应用案例,帮助读者全面掌握 Excel 应用技术。全书分为 6 篇 51 章,内容包括 Excel 基本功能、使用公式与函数、数据可视化常用功能、使用 Excel 进行数据分析、Power BI in Excel、协同与其他特色功能、宏与 VBA。附录中还提供了 Excel 规范与限制,Excel 常用快捷键以及 Excel 术语简繁英文词汇对照表等内容,方便读者查阅。
本书适合各层次的 Excel 用户,既可作为初学者的入门指南,又可作为中、高级用户的参考手册。
抽奖送书老规矩(不点赞收藏中奖无效):注意记得关注博主不然中奖了还不知道!!!
- 1. 点赞收藏文章
- 2. 评论区留言:人生苦短,我用Python!!!(留言才能进入奖池,每人最多留言三条)
- 3. 周日八点爬虫抽奖5人
- 如果不想抽奖当当自营购买链接:http://product.dangdang.com/29553905.html
