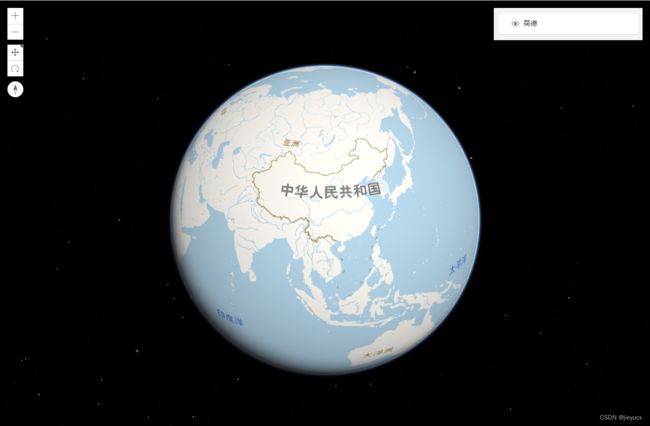
arcgis for javascript TileLayer 自定义高德地图图层
效果如图:
一、创建自定义切片层
要创建自定义图块层,您必须调用BaseTileLayer类的createSubclass()方法。命名自定义层为TintLayer
由于这一层需要知道在哪里访问预定义的图块,我们将创建一个属性。应用程序将为图层提供值,图层将从生成的 URL 中获取切片。然后在显示每个图像之前将差异混合操作应用于 Stamen 块。我们将在该层上创建一个属性,以便应用程序可以指定一种颜色,该颜色将用于混合操作
const TintLayer = BaseTileLayer.createSubclass({
  // 设置特定于此图层的特性
  properties: {
    // tile的url,由应用程序提供
    urlTemplate: null,
	// 更改图层颜色
    tint: {
      value: null,
      type: Color
    }
  }
});
可以通过两种不同的方式扩展 BaseTileLayer:
- 请求图块,因为它们是从数据源预定义的
- 图像或数据需要在视图中显示之前进行预处理
二、请求图块
要请求从数据源预定义的图像,请覆盖getTileUrl()方法,以便它返回给定级别、行和列的所请求图块的 URL。
const MyCustomTileLayer = BaseTileLayer.createSubclass({
  properties: {
    urlTemplate: null
  },

  // 重写getTileUrl()
  // 为LayerView提供的给定级别、行和列生成tile url
  getTileUrl: function(level, row, col) {
    return this.urlTemplate
      .replace("{z}", level)
      .replace("{x}", col)
      .replace("{y}", row);
  }
});
三. 图像或数据在视图中显示之前需要进行预处理
如果数据或图块需要在显示前进行预处理,则覆盖fetchTile()方法。图像和颜色混合后,最终结果将显示在视图中
const TintLayer = BaseTileLayer.createSubclass({
          properties: {
            urlTemplate: null,
            tint: {
              value: null,
              type: Color,
            },
          },

          //为LayerView提供的给定级别、行和列生成tile url
          getTileUrl: function (level, row, col) {
            return this.urlTemplate.replace("{z}", level).replace("{x}", col).replace("{y}", row);
          },

          // 此方法获取指定级别和大小的瓦片
          // 重写此方法以处理从服务器返回的数据
          fetchTile: function (level, row, col, options) {
            // 调用getTileUrl()方法来构造tiles的URL
            // 对于LayerView提供的给定级别、行和列
            const url = this.getTileUrl(level, row, col);

            // 基于生成的url请求平铺
            // the signal option 确保废弃的请求被中止
            return esriRequest(url, {
              responseType: "image",
              signal: options && options.signal,
            }).then(
              function (response) {
                // esri请求解析成功时
                // 从响应中获取图像
                const image = response.data;
                const width = this.tileInfo.size[0];
                const height = this.tileInfo.size[0];

                // 使用二维渲染上下文创建画布
                const canvas = document.createElement("canvas");
                const context = canvas.getContext("2d");
                canvas.width = width;
                canvas.height = height;

                // 将应用程序提供的色调应用于画布
                if (this.tint) {
                  // 获取一个rgba形式的CSS颜色字符串,表示tint color实例.
                  context.fillStyle = this.tint.toCss();
                  context.fillRect(0, 0, width, height);

                  // 在画布和steman平铺之间应用“差异”混合操作。差值混合操作从顶层(瓦片)中减去底层(画布),或者反过来总是得到一个正值
                  context.globalCompositeOperation = "difference";
                }

                //将混合图像绘制到画布上。
                context.drawImage(image, 0, 0, width, height);

                return canvas;
              }.bind(this)
            );
          },
        });
四、使用自定义切片层
        // 创建TintLayer的新实例并设置其属性
        let jianyueTileLayer = new TintLayer({
          urlTemplate: "http://webst01.is.autonavi.com/appmaptile?style=7&x={x}&y={y}&z={z}",
          title: "高德",
        });
        // 将自定义平铺层的新实例添加到地图
        const map = new Map({
          layers: [jianyueTileLayer],
        });

        // 创建新的场景视图并添加贴图
        const view = new SceneView({
          container: "viewDiv",
          map: map,
          center: [0, 30],
          zoom: 3,
          environment: {
            lighting: {
              type: "virtual",
            },
          },
        });
五、完整代码如下:
<html lang="en">
  <head>
    <meta charset="utf-8" />
    <meta name="viewport" content="initial-scale=1,maximum-scale=1,user-scalable=no" />
    <title>Custom TileLayertitle>
    <style>
      html,
      body,
      #viewDiv {
        padding: 0;
        margin: 0;
        height: 100%;
        width: 100%;
      }
    style>
    <link rel="stylesheet" href="https://js.arcgis.com/4.26/esri/themes/light/main.css" />
    <script src="https://js.arcgis.com/4.26/">script>

    <script>
      require([
        "esri/Map",
        "esri/request",
        "esri/Color",
        "esri/views/SceneView",
        "esri/widgets/LayerList",
        "esri/layers/BaseTileLayer",
      ], (Map, esriRequest, Color, SceneView, LayerList, BaseTileLayer) => {
        // *******************************************************
        // 自定义图层类代码
        // 创建一个BaseTileLayer的子类
        // *******************************************************

        const TintLayer = BaseTileLayer.createSubclass({
          properties: {
            urlTemplate: null,
            tint: {
              value: null,
              type: Color,
            },
          },

          //为LayerView提供的给定级别、行和列生成tile url
          getTileUrl: function (level, row, col) {
            return this.urlTemplate.replace("{z}", level).replace("{x}", col).replace("{y}", row);
          },

          // 此方法获取指定级别和大小的瓦片
          // 重写此方法以处理从服务器返回的数据
          fetchTile: function (level, row, col, options) {
            // 调用getTileUrl()方法来构造tiles的URL
            // 对于LayerView提供的给定级别、行和列
            const url = this.getTileUrl(level, row, col);

            // 基于生成的url请求平铺
            // the signal option 确保废弃的请求被中止
            return esriRequest(url, {
              responseType: "image",
              signal: options && options.signal,
            }).then(
              function (response) {
                // esri请求解析成功时
                // 从响应中获取图像
                const image = response.data;
                const width = this.tileInfo.size[0];
                const height = this.tileInfo.size[0];

                // 使用二维渲染上下文创建画布
                const canvas = document.createElement("canvas");
                const context = canvas.getContext("2d");
                canvas.width = width;
                canvas.height = height;

                // 将应用程序提供的色调应用于画布
                if (this.tint) {
                  // 获取一个rgba形式的CSS颜色字符串,表示tint color实例.
                  context.fillStyle = this.tint.toCss();
                  context.fillRect(0, 0, width, height);

                  // 在画布和steman平铺之间应用“差异”混合操作。差值混合操作从顶层(瓦片)中减去底层(画布),或者反过来总是得到一个正值
                  context.globalCompositeOperation = "difference";
                }

                //将混合图像绘制到画布上。
                context.drawImage(image, 0, 0, width, height);

                return canvas;
              }.bind(this)
            );
          },
        });
        let jianyueTileLayer = new TintLayer({
          urlTemplate: "http://webst01.is.autonavi.com/appmaptile?style=7&x={x}&y={y}&z={z}",
          title: "高德",
        });
        // 将自定义平铺层的新实例添加到地图
        const map = new Map({
          layers: [jianyueTileLayer],
        });

        // 创建新的场景视图并添加贴图
        const view = new SceneView({
          container: "viewDiv",
          map: map,
          center: [0, 30],
          zoom: 3,
          environment: {
            lighting: {
              type: "virtual",
            },
          },
        });

        // 创建图层列表小部件
        const layerList = new LayerList({
          view: view,
        });
        view.ui.add(layerList, "top-right");
      });
    script>
  head>

  <body>
    <div id="viewDiv">div>
  body>
html>