用于改进筛查的乳腺癌异常检测
介绍
乳腺癌是一种严重的疾病,影响着全世界数以百万计的妇女。即使医学领域有了进步,对乳腺癌进行识别和治疗是可能的,但发现它并在早期阶段治疗它仍然是不可能的。
通过使用异常检测技术,我们可以识别出乳腺癌中肉眼可能看不到的微小但重要的模式。通过提高筛查方法的准确性,可以挽救许多生命,我们可以帮助他们战胜乳腺癌。
在这一代计算机控制的医疗保健中,异常检测是一种强大的工具,可以改变我们处理乳腺癌筛查和治疗的方式。

学习目标
在本文中,我们将执行以下操作:
我们将探索数据并识别任何潜在的异常情况。
我们将创建可视化效果以更好地了解数据及其异常情况。
我们将训练并建立一个模型来检测任何异常数据点。
我们将分析和解释我们的结果,以得出关于乳腺癌的有意义的结论。
什么是乳腺癌?
当乳腺细胞不受控制地生长并且可以在乳房的各个部位发现时,乳腺癌就会发生。它可以通过血管和淋巴管扩散到身体的其他部位,从而发生转移。
为什么早期发现乳腺癌至关重要?
当我们忽视或不关心癌症症状或延迟治疗时,生存机会就会很低。与此相关的问题会更多,在后期或最后阶段,治疗可能无效,医疗保健费用也会增加。早期治疗可能有助于战胜癌症,因此尽早治疗非常重要。
乳腺癌有哪些类型?
有几种类型的乳腺癌,其中一些是:
IDC(浸润性导管癌)
ILC(浸润性小叶癌)
IBC(炎性乳腺癌)
TNBC(三阴性乳腺癌)
MBC(转移性乳腺癌)
DCIS(导管原位癌)
LCIS(小叶原位癌)
乳腺癌的症状
在腋下或乳房形成新的肿块。
乳房或部分乳房会肿胀。
乳房附近的刺激。
乳头或乳房附近的皮肤可能会变干。
乳房区域可能有疼痛。
乳腺癌的诊断
对于乳腺癌的诊断,需要进行以下操作:
乳房检查:在此过程中,医生将检查双侧乳房是否有肿块或任何其他异常。
乳房 X 光检查:乳房 X 光检查称为乳房 X 光检查。这些通常用于筛查乳腺癌。如果在 X 光片中发现任何异常,医生会建议进行进一步手术所需的治疗。
乳房超声检查:进行乳房超声检查以检查形成的肿块是实性肿块还是充满液体的囊肿。
样品采集:这个过程称为活检。在此过程中,使用专门的针头装置对肿块进行取样,并从患处提取肿块的核心。
检测乳腺癌的最佳方法
活组织检查,即乳房 X 光检查是识别乳腺癌的最佳方法之一。另一个最好的方法据说是MRI(磁共振成像),通过它我们可以识别出乳腺癌的风险程度。
我们如何使用机器学习检测乳腺癌?
我们可以使用许多机器学习算法来检测乳腺癌疾病,这些算法包括支持向量机、决策树和神经网络。
使用这些算法,我们可以在早期预测癌症,这将有助于减缓疾病的传播并增加挽救患者生命的可能性。
理解数据和问题陈述
本项目使用的数据集来自 UCI 机器学习库,包含 569 个乳腺癌实例和 30 个属性。感兴趣的读者可以点击以下链接下载数据集:https://archive.ics.uci.edu/ml/datasets/Breast+Cancer+Wisconsin+(Diagnostic)
该数据集在 scikit-learn 库中可用,scikit-learn 库是一个流行的 Python 机器学习库。通过阅读此博客,读者将更好地了解检测乳腺癌数据异常所涉及的复杂性,以及如何有效地将数据集用于机器学习目的。
问题陈述——乳腺癌异常检测
该项目的目标是了解数据并找出不规则乳腺癌的发生。在这里,我们将使用Python中的孤立森林库来构建和训练模型,以找到数据集中不均匀的数据点。
最终,我们将研究并阐明我们的结果,以从数据中得出有意义的结论。
项目的管道
项目管道包括多个步骤,它们是:
导入库
加载数据集
探测数据分析
数据预处理
可视化数据
将数据拆分为训练和测试数据集
使用 IsolationForest 预测异常
使用 LocalOutlierFactor 预测异常
第 1 步:导入库
import pandas as pd
import matplotlib.pyplot as plt
import seaborn as sns12345python
第 2 步:加载和读取数据集
df = pd.read_csv('data.csv')
df.head(5)
输出:

第 3 步:探测数据分析
3.1:获取数据中的前5条记录
df.head(5)输出:

3.2:找出数据集中的列数
df.columns输出:
Index(['id', 'diagnosis', 'radius_mean', 'texture_mean', 'perimeter_mean',
'area_mean', 'smoothness_mean', 'compactness_mean', 'concavity_mean',
'凹点_均值','对称_均值','分形_维数_均值',
'radius_se', 'texture_se', 'perimeter_se', 'area_se', 'smoothness_se',
'compactness_se', 'concavity_se', '凹点_se', 'symmetry_se',
'fractal_dimension_se', 'radius_worst', 'texture_worst',
'perimeter_worst', 'area_worst', 'smoothness_worst',
'compactness_worst', 'concavity_worst', 'concave points_worst',
'symmetry_worst', 'fractal_dimension_worst', 'Unnamed: 32'],
dtype='对象')
1234567891011蟒蛇
3.3:求数据长度
print('length of data is', len(df))输出:
数据长度为569
3.4:获取数据的形状
df.shape输出:
(569, 33)
3.5:数据信息
df.info()输出:

3.6:列的数据类型
df.dtypes输出:

3.7:查找数据集是否有空值
np.sum(df.isnull().any(axis=1))输出:
0
3.8:数据集中的行数和列数
print('Count of columns in the data is: ', len(df.columns))
print('Count of rows in the data is: ', len(df))
输出:
数据中的列数为:31
数据中的行数是:569
3.9:检查诊断的唯一值
df['diagnosis'].unique()输出:
array([1, 0])
3.10:诊断值个数
df['diagnosis'].nunique()输出:
2个
第 4 步:数据预处理
4.1:处理缺失值
在预处理过程中,如果数据集包含缺失值,处理缺失值是最重要的步骤之一。缺失值的存在会导致许多问题,例如它可能会导致程序出错,或者只是数据一开始就不可用。根据数据的性质,有许多技术可以处理错误类型。
基本上,有些技术总是适合处理缺失值。在某些情况下,如果缺失值非常少或非常多或与给定数据无关或可能对构建模型没有用,我们会删除行或列。我们将使用 is.null() 函数来查找缺失值。
def null_values(data):
  null_values = data.isnull().sum()
  null_values = null_values[null_values > 0]
  null_values.sort_values(inplace=True)
  print(null_values)
null_values(datas)
输出:
Series([ ], dtype: int64)
数据中没有缺失值。
4.2:编码数据
在数据预处理阶段,下一步涉及将数据编码为适合模型构建的形式。此步骤涉及将分类变量转换为数字形式,即,将变量的数据类型从对象更改为 int64,将数据缩小到标准范围,或应用任何其他转换来创建干净的数据集。
在这个基于项目的博客中,我们将使用 sklearn 中的 LabelEncoder 方法。预处理库将分类变量转换为数值变量,以便我们可以在训练模型时使用该变量。
为了进一步详细说明数据预处理步骤,对数据进行编码甚至可视化非常重要。许多图不会使用分类变量来解释结果,因为它们是基于数值计算的。虽然我们在这个基于项目的博客中使用的是LabelEncoder方法,但我们也可以根据模型的需要使用one-hot encoding、binary encoding等方法。
将数据缩放到标准范围对于确保变量的权重相等,以及我们的模型不偏向某个特定特征非常必要。这可以使用标准化或规范化等方法来实现。
在下面的代码中,我们首先从 sklearn 导入 LabelEncoder。预处理然后创建该方法的对象。最后我们将使用该对象调用 fit_transform 函数将指定变量转换为数值数据类型。
from sklearn.preprocessing import LabelEncoder
le=LabelEncoder()
data['diagnosis']=le.fit_transform(data['diagnosis'])
df.head()
输出:

第 5 步:可视化数据
为了更好地理解数据及其异常,我们将尝试不同类型的可视化。在这些可视化中,我们可以执行散点图、直方图、箱线图等。通过这种方式,我们可以识别不太可能与原始数据相关的数据异常值和模式。这些将主要帮助我们构建有效的异常检测模型。
除此之外,我们还可以使用其他技术(例如聚类或回归分析)来进一步分析数据并了解模型的各种属性。
总的来说,我们的主要目标是建立一个独特且可靠的模型,该模型可以准确地检测并引导我们发现数据中的任何异常或意外模式,这有助于我们在可能造成任何重大损害之前发现可能出现的问题。
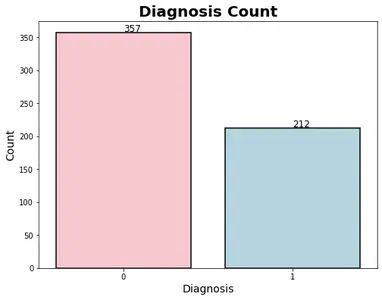
#Number of Malignant(M) and Benign(B) cells

plt.figure(figsize=(8, 6))

sns.countplot(x='diagnosis', data=df, palette= ['#FFC0CB', '#ADD8E6'],
            edgecolor='black', linewidth=1.5)

plt.title('Diagnosis Count', fontsize=20, fontweight='bold')
plt.xlabel('Diagnosis', fontsize=14)
plt.ylabel('Count', fontsize=14)

ax = plt.gca()

for patch in ax.patches:
    plt.text(x=patch.get_x()+0.4, y=patch.get_height()+2,
    s=str(int(patch.get_height())), fontsize=12)
输出:

plt.figure(figsize=(25,15))
sns.heatmap(df.corr(),annot=True, cmap='coolwarm')
输出:

核密度估计图显示了乳腺癌数据集中良性和恶性肿瘤中“radius_mean”的分布
def plot_distribution(df, var, target, **kwargs):
    row = kwargs.get('row', None)
    col = kwargs.get('col', None)
    facet = sns.FacetGrid(df, hue=target, aspect=4, row=row, col=col)
    facet.map(sns.kdeplot, var, shade=True)
    facet.set(xlim=(0, df[var].max()))
    facet.add_legend()
    plt.show()
plot_distribution(df, var='radius_mean', target='diagnosis')
输出:

散点图显示了乳腺癌数据集的良性和恶性肿瘤中“radius_mean”和“texture_mean”之间的关系。
def plot_scatter(df, var1, var2, target, **kwargs):
    row = kwargs.get('row', None)
    col = kwargs.get('col', None)
    facet = sns.FacetGrid(df, hue=target, aspect=4, row=row, col=col)
    facet.map(plt.scatter, var1, var2, alpha=0.5)
    facet.add_legend()
    plt.show()
plot_scatter(df, var1='radius_mean', var2='texture_mean', target='diagnosis')
输出:

import plotly.express as px
fig = px.parallel_coordinates(df, dimensions=['radius_mean', 'texture_mean', 'perimeter_mean',
          'area_mean', 'smoothness_mean', 'compactness_mean',
          'concavity_mean', 'concave points_mean', 'symmetry_mean',
          'fractal_dimension_mean'],
      color='diagnosis', color_continuous_scale=px.colors.sequential.Plasma,
    labels={'radius_mean': 'Radius Mean', 'texture_mean': 'Texture Mean',
  perimeter_mean': 'Perimeter Mean', 'area_mean': 'Area Mean',
  'smoothness_mean': 'Smoothness Mean', 'compactness_mean': 'Compactness Mean',
   'concavity_mean': 'Concavity Mean', 'concave points_mean': 'Concave Points Mean',
   symmetry_mean': 'Symmetry Mean', 'fractal_dimension_mean': 'Fractal Dimension Mean'},
   title='Breast Cancer Diagnosis by Mean Characteristics')

fig.show()
输出:

第 6 步:模型开发
模型开发过程利用 Python 的 scikit-learn 库来训练和开发识别隐藏数据点的孤立模型。使用了一种称为孤立森林的无监督学习算法,该算法以其在异常检测中的有效性而闻名。它涉及创建一个随机的孤立树森林,用随机选择的数据子集对每个树进行训练。根据数据点的平均路径长度检测异常值。
通过使用这种技术,我们可以识别数据中未在原始数据中立即识别的隐藏异常值和模式。总的来说,我们可以说孤立森林算法是一种强大的乳腺癌数据异常检测工具,它还能够彻底改变我们筛查和治疗这种疾病的方法。
6.1:将数据拆分为特征和目标
from sklearn.feature_selection import SelectKBest, f_classif
# Split the data into features and target
X = df.drop(['diagnosis'], axis=1)
y = df['diagnosis']
6.2:打印X和Y值:
x.head()输出:

y.head()输出:
输出
6.3:使用 SelectKBest 和 f_classif 进行特征选择
# Performing feature selection using SelectKBest and f_classif
selector = SelectKBest(score_func=f_classif, k=5)
selector.fit(X, y)
输出:
SelectKBest
SelectKBest(k=5)
6.4:获取所选特征的索引
# Getting the indices of the selected features
selected_indices = selector.get_support(indices=True)
6.5:获取选中特征的名称并打印
# Getting the names of the selected features
selected_features = X.columns[selected_indices].tolist()
# Printing the selected features
print(selected_features)
输出:
[‘perimeter_mean’, ‘concave points_mean’, ‘radius_worst’, ‘perimeter_worst’, ‘concave points_worst’]
第 7 步:将数据拆分为训练和测试数据集
x = df[selected_features]
y = df['diagnosis']
from sklearn.model_selection import train_test_split
X_train, X_test, y_train, y_test = train_test_split(x, y, test_size=0.3)
第 8 步:使用 IsolationForest 预测异常
8.1:在训练数据上拟合孤立森林模型
from sklearn.ensemble import IsolationForest
from sklearn.metrics import classification_report
# Fit an Isolation Forest model on the training data
clf = IsolationForest(n_estimators=100, max_samples="auto", contamination="auto", random_state=42)
clf.fit(X_train)
输出:
IsolationForest
IsolationForest(random_state=42)
8.2:使用模型预测测试数据中的异常值
# Using the model to predict outliers in the test data
y_pred = clf.predict(X_test)
y_pred = np.where(y_pred == -1, 1, 0)  # Convert -1 (outlier) to 1, and 1 (inlier) to 0
输出:
array([1, 1, 0, 0, 1, 0, 0, 0, 0, 0, 1, 0, 0, 0, 0, 0, 0, 0, 0, 0, 0, 0, 1, 0, 1, 0, 0, 0, 0, 1, 0, 1, 1, 0, 0, 0, 1, 0, 0, 0, 1, 0, 0, 0, 0, 0, 0, 1, 0, 0, 0, 0, 0, 1, 0, 0, 1, 1, 0, 0, 0, 0, 0, 0, 0, 0, 0, 0, 0, 0, 0, 0, 0, 1, 1, 0, 0, 0, 0, 1, 0, 0, 0, 1, 0, 0, 0, 0, 0, 0, 0, 0, 0, 0, 0, 0, 0, 1, 0, 0, 1, 0, 0, 0, 0, 0, 0, 0, 1, 0, 0, 0, 0, 0, 0, 0, 0, 0, 1, 0, 0, 0, 0, 1, 0, 0, 0, 1, 0, 1, 0, 0, 1, 0, 0, 1, 0, 0, 1, 0, 0, 0, 0, 1, 0, 0, 0, 0, 0, 0, 0, 0, 0, 0, 1, 0, 1, 0, 0, 0, 0, 0, 0, 0, 1, 1, 1, 0, 0, 1, 0])
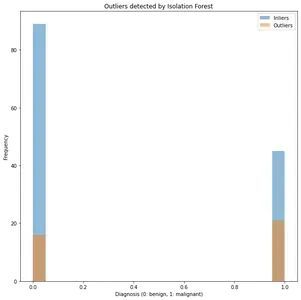
8.3:绘制异常值
# plot the outliers keep in  red color
plt.figure(figsize=(10,10))
plt.hist(y_test[y_pred==0], bins=20, alpha=0.5, label="Inliers")
plt.hist(y_test[y_pred==1], bins=20, alpha=0.5, label="Outliers")
plt.xlabel("Diagnosis (0: benign, 1: malignant)")
plt.ylabel("Frequency")
plt.title("Outliers detected by Isolation Forest")
plt.legend()
plt.show()
输出:

第 9 步:使用 LocalOutlierFactor 预测异常
9.1:预测异常
import plotly.graph_objs as go
from sklearn.neighbors import LocalOutlierFactor

model = LocalOutlierFactor(n_neighbors=20, contamination=0.05)
model.fit(X)
# Predicting anomalies
y_pred1 = model.fit_predict(X)
9.2:创建散点图并为注释添加图例
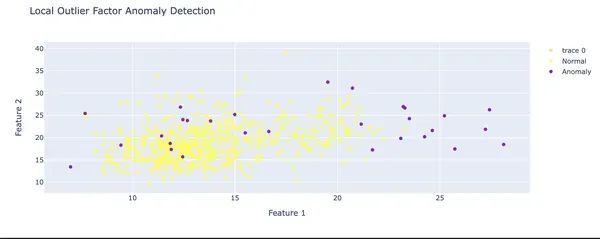
# Creating scatter plot
fig = go.Figure()
fig.add_trace(
go.Scatter(
x=X.iloc[:, 0],
y=X.iloc[:, 1],
mode='markers',
marker=dict(
color=y_pred1,
colorscale='viridis'
),
hovertemplate='Feature 1: %{x}
Feature 2: %{y}输出:

结论
在这个基于项目的博客中,我们研究了乳腺癌数据中的异常检测。我们使用 Python 的 Scikit-learn 库构建和训练孤立森林模型,以检测数据集中的隐藏数据点。该模型能够发现数据中的异常值和隐藏模式,并帮助我们得出有意义的结论。
通过改进筛查方法的准确性,我们有可能挽救无数生命并帮助他们抗击乳腺癌。通过使用这些机器学习和数据可视化技术,我们可以更好地理解与检测乳腺癌数据异常相关的并发症,我们可以在学习有效治疗方法方面领先一步。总而言之,该项目取得了显著成功,并为乳腺癌数据分析和异常检测找到了一种新方法。
关键要点
通过使用异常检测方法,我们可以识别乳腺癌数据中微妙但重要的模式。
通过提高筛查方法的准确性,我们可以挽救许多生命并帮助战胜乳腺癌。
Isolation Forest 算法是检测乳腺癌数据异常的强大工具,有可能彻底改变我们对这种疾病进行筛查和治疗的方法。
☆ END ☆
如果看到这里,说明你喜欢这篇文章,请转发、点赞。微信搜索「uncle_pn」,欢迎添加小编微信「 woshicver」,每日朋友圈更新一篇高质量博文。
↓扫描二维码添加小编↓
