推荐系统---AUC / NDGG
目录:
- ROC / AUC
-
- 1:坐标含义
-
- (横坐标)FPR:伪阳性率,分类器 “分类错误的负样本个数” 占 “总负样本个数” 的比例。
- (纵坐标)TPR:真阳性率,分类器 “分类正确的正样本个数” 占 “总正样本个数” 的比例。(召回率)
- 2:如何绘制roc曲线
-
- 方法1:阈值法:更改阈值计算坐标点
- 方法2:折线法:遇到正负样本就画折线 (样本概率从大到小排,经过一个正样本就向上,经过一个负样本就往右)
- 3:如何计算auc值
-
- 方法1:根据定义(随机抽取样本对,正>负的概率)
- 公式:[rank(正)累加 - m(m+1)/2] / m*n
-
- 分母:比如正M个,负N个,正负对为 M * N
- 分子:正样本排名(从大到小)相加 - (1+2+...m-1)
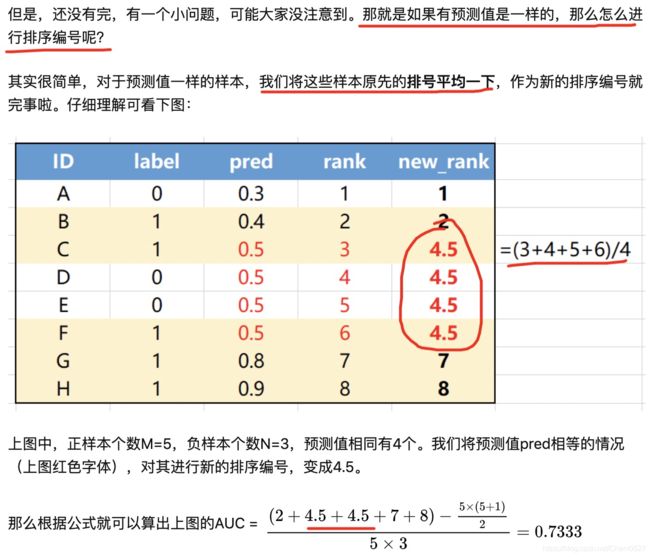
- 问题:两个样本概率值一样怎么办?(rank按照平均值处理)
- 实现方法:
- 方法2:按照图像面积累加(最后转化后跟公式版一样)
-
- 横面积:以负样本为阈值,每次为一格,每次就是1 / N
- 纵面积:第一次大于负样本(第一个)为 a1/M 个,第二次大于负样本(第二个)为 a2/M 个。
- 总面积:1 / N * a1/M + 1 / N * a2/M + .... = (a1+a2+... )/ M*N ; 分子为正大于负的总个数。
- 总结:其实就是按照第二种画法去求的,将样本拍好序列,然后对于每个负样本为阈值,每过一次负样本就往横坐标去移动,然后横坐标的分割为1/N,纵坐标的高度即为每个负样本socre高的正样本的个数,即为正样本概率大于负样本概率的个数。
- 5:auc优点 / 缺点
-
- 优点:
-
- a:AUC衡量的是一种排序能力,因此特别适合排序类业务;
- b:AUC对正负样本均衡并不敏感,在样本不均衡的情况下,也可以做出合理的评估。其他指标比如precision,recall,F1,根据区分正负样本阈值的变化会有不同的结果,而AUC不需要手动设定阈值,是一种整体上的衡量方法。
- 缺点:
-
- a:忽略了预测的概率值和模型的拟合程度;
- b:AUC反应了太过笼统的信息。无法反应召回率、精确率等在实际业务中经常关心的指标;它没有给出模型误差的空间分布信息,AUC只关注正负样本之间的排序,并不关心正样本内部,或者负样本内部的排序,这样我们也无法衡量样本对于好坏客户的好坏程度的刻画能力;
- 6:采样对AUC的影响?
-
- 问题:负采样在什么情况下提高auc ? 有些时候负采样提高不了auc。
- 7:auc衍生指标
-
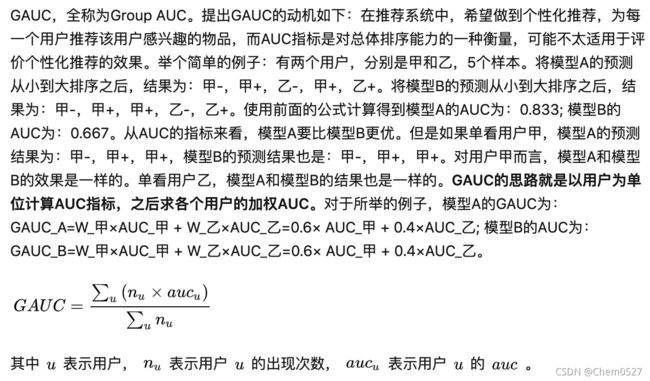
- 衍生1:总体计算没有反映个人(gauc)
-
- auc缺点:
-
- 1:不同用户,对比的个数不一样。造成影响不一样。
- 2:无法体现不同用户真实的排序能力。
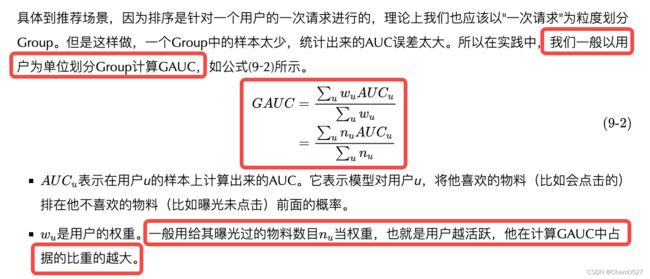
- 如何计算GAUC:一般场景下权重为用户曝光的长度。
- trick:
-
- 1:实际处理时可以尝试过滤掉单个用户全是正样本或负样本的情况。
- 2:尽量不做batch的gauc指标,无法捕捉到用户的所有样本。
- gauc其他场景的用处:
-
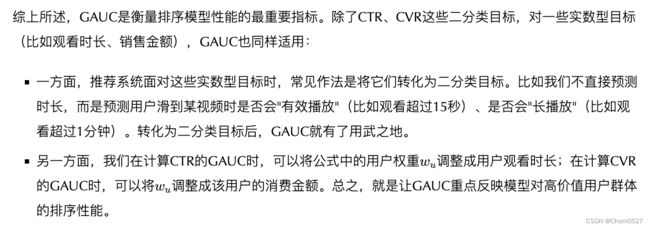
- 1:实数型目标时,转化为2分类,比如预测时长转为“有效播放”,“是否长播放”。
- 2:在计算ctr的gauc时候,将权重调整为用户观看时长;计算cvr时候,转为用户消费金额。将重点反应模型对高价值用户群体的排序性能。
- gauc代码实现:
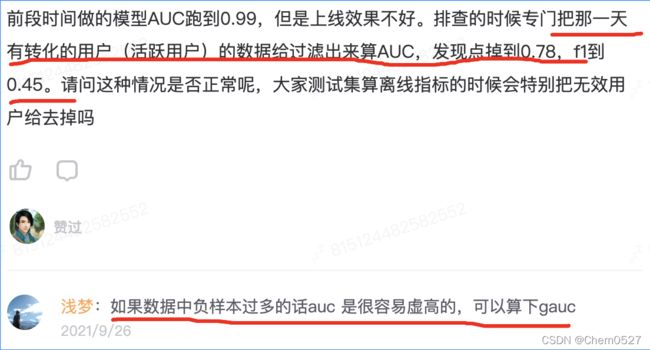
- 8:你auc为啥这么高?过拟合了吧!论不平衡数据的评价指标选择
-
- 现象:比如阈值0.5,label=1样本在0.7正太分布,如果100个正样本,那么在0.5以上有80个,召回率80%,准确率为XX,如果1000个正样本,那么在0.5以上有800个,召回率80%不变,但是准确率就会变大,因为正样本在所有样本中的比例变大。
- 总结:不平衡比例在1:1到1:10的时候,如果你对正负样本的识别都比较看重,可以用用Accurate;在1:10到1:100之间的时候,可以用用AUC;极端不平衡时,分段统计P和R更加务实。
- 衍生2:在广告场景中有缺陷(CPM-sensitive AUC)
- 问题:auc / PR 区别
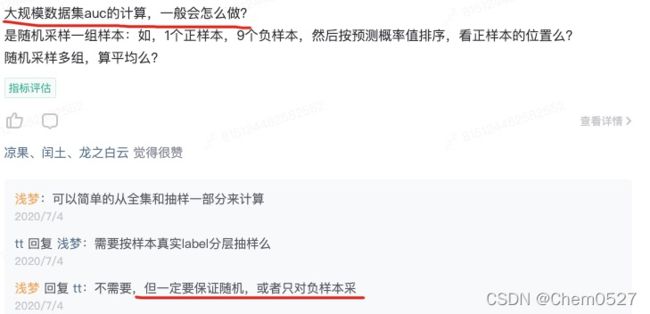
- 问题:大数据量AUC怎么计算?
-
- 方法1:采样
- 方法2:[基于 PS-Lite 分布式计算 AUC](https://zhuanlan.zhihu.com/p/87339470)
- NDCG:考虑到每个位置上物料带来的收益和这个位置上的折扣效应。
-
- 解决的问题:排序越靠前越有可能被点击,auc不能反应这个“折扣”现象,比如[Plong,N1,Pshort,N2],与[Pshort,N1,Plong,N2],auc计算结果一样。
- DCG:
- IDCG:理论上完美的排序模型,按照物料的真实贡献度排名。
- 归一化 NDCG@K = DCG@K / IDDCG@K
ROC / AUC
看完这篇AUC文章,搞定任何有关AUC的面试不成问题~
随机挑选一个正样本和负样本,分类器将正样本排在负样本前面的概率。
使用AUC或者logloss可以避免把预测概率转换成类别。
1:坐标含义
(横坐标)FPR:伪阳性率,分类器 “分类错误的负样本个数” 占 “总负样本个数” 的比例。
(纵坐标)TPR:真阳性率,分类器 “分类正确的正样本个数” 占 “总正样本个数” 的比例。(召回率)
与基尼系数关系:gini+1 = 2*AUC
可以通过约登指数(TPR+1-FPR)取得最大时的阈值来确定一个分类器合适的阈值;
2:如何绘制roc曲线
方法1:阈值法:更改阈值计算坐标点
样本概率从大到小排,然后遍历每个样本进行设置阈值,分别计算横纵坐标,当我们将threshold设置为1和0时,分别可以得到ROC曲线上的(0,0)和(1,1)两个点。将这些(FPR,TPR)对连接起来,就得到了ROC曲线。当threshold取值越多,ROC曲线越平滑。(记好召回率大的时候就是阈值小的时候,把所有物品都判为正。)
方法2:折线法:遇到正负样本就画折线 (样本概率从大到小排,经过一个正样本就向上,经过一个负样本就往右)
3:如何计算auc值
方法1:根据定义(随机抽取样本对,正>负的概率)
公式:[rank(正)累加 - m(m+1)/2] / m*n
分母:比如正M个,负N个,正负对为 M * N
分子:正样本排名(从大到小)相加 - (1+2+…m-1)
其实分子就是想计算出所有正比负大的组合数目,那么我们先按照score排序后,把所有正的score加起来,每个正的排名(99),就代表着这个正样本要比99个样本score大,但是里面包含了一部分正正情况(第一名正,包含了M-1种情况,第二名正包含了M-2种,最后一名正包含0种正正),所以将所有正的排名加起来再减去各自正正的个数,就是所有样本中正比负score大的个数。
手动版:

上式中,统计一下所有的 M×N(M为正类样本的数目,N为负类样本的数目)个正负样本对中,有多少个组中的正样本的score大于负样本的score。当二元组中正负样本的 score相等的时候,按照0.5计算。然后除以MN。
问题:两个样本概率值一样怎么办?(rank按照平均值处理)
实现方法:
实现1:
实现2:
def calAUC(prob,labels):
    """
    计算AUC主题逻辑
    :param prob:
    :param labels:
    :return:
    """

    # 组装预测值、标签,返回 List[(0.011547, 1), (0.00102014, 0), (0.000152839, 1)] 形式
    f = list(zip(prob, labels))
    # 以预测值为key进行排序,得到rank,记录了按照预测值排序后的label
    rank = [values2 for values1, values2 in sorted(f, key=lambda x:x[0])]
    # rankList记录了rank中正样本的位置(从1开始)
    rankList = [i+1 for i in range(len(rank)) if rank[i]==1]
    posNum = 0
    negNum = 0
    # 遍历label列表,查找正负样本数
    for i in range(len(labels)):
        if labels[i] == 1:
            posNum += 1
        else:
            negNum += 1
    auc = 0
    # 计算AUC, 计算公式 AUC = {正样本位置的和 - [正样本数*(正样本数+1)]/2} / 正样本数*负样本数
    auc = (sum(rankList) - (posNum*(posNum+1))/2)/(posNum*negNum)
    return auc


y = []
pred = []
with open("result_v1", 'r') as infile:
    for line in infile:
        pred.append(float(line.strip()))
with open("data/test_shuffle", 'r') as infile:
    for line in infile:
        y.append(int(line.strip().split(' ')[0]))

print(calAUC(pred,y))
实现3:
#!/usr/bin/env python
#-*- coding: utf-8 -*-
# ******************************************************************************
# 程序名称: roc_auc_score.py
# 功能描述: 计算roc曲线下方的面积
# 创建人名: aylanyang
# 创建日期: 2019-09-03
# 版本说明: v1.0
# ******************************************************************************

## import
import numpy as np
from sklearn.metrics import roc_auc_score, roc_curve
import matplotlib.pyplot as plt

def roc_auc_score_v1(prob, label):
    '''
    :param prob: 预测值
    :param label: 真实值
    :return: auc
    '''
    listTuple = list(zip(label, prob))
    rank = [values2 for values1, values2 in sorted(listTuple, key=lambda x: x[0])]
    rankList = [i+1 for i in range(len(rank)) if rank[i]==1]
    posNum = 0
    negNum = 0
    for i in range(len(label)):
        if(label[i] == 1):
            posNum += 1
        else:
            negNum += 1
    auc = (sum(rankList) - (posNum*(posNum+1))/2)/(posNum*negNum)
    return auc

def plot_roc(label, prob):
    fpr, tpr, _ = roc_curve(label, prob, pos_label=1)
    plt.figure()
    plt.plot(fpr, tpr, color='darkorange', lw=2, label='ROC Curve (Area = {:.2f}'.format(roc_auc_score(label, prob)))
    plt.plot([0, 1], [0, 1], color='navy', linestyle='--')
    plt.xlim([0, 1])
    plt.ylim([0, 1.05])
    plt.xlabel('False Positive Rate')
    plt.ylabel('True Postive Rate')
    plt.title('Receiver Operating Characteristic Curve')
    plt.legend(loc='lower right')
    plt.savefig('roc.png')
    plt.show()

if __name__ == "__main__":
    prob = np.array([0.1, 0.2, 0.3, 0.4, 0.5, 0.6, 0.7, 0.8, 0.9])
    label = np.array([0, 0, 0, 1, 0, 1, 1, 0, 1])
    auc = roc_auc_score_v1(label, prob)
    print('roc auc score: {:.4f}'.format(auc))
    auc = roc_auc_score(label, prob)
    print('roc auc score: {:.4f}'.format(auc))
    plot_roc(label, prob)
实现4:
import numpy as np
import matplotlib.pyplot as plt


def get_roc(y_label, y_score):

    """

    :param y_label:
    :param y_score:
    :return:
    """
    assert len(y_label) == len(y_score)
    # invert sort y_pred
    score_indices = np.argsort(y_score, kind="mergesort")[::-1]
    y_prob = np.array(y_score)[score_indices]
    y_true = np.array(y_label)[score_indices]

    # ------------------get tps and fps at distinct value -------------------------
    # extract the indices associated with the distinct values
    distinct_value_indices = np.where(np.diff(y_prob))[0]
    threshold_idxs = np.r_[distinct_value_indices, y_true.size - 1]

    # accumulate the true positives with decreasing threshold
    tps = np.cumsum(y_true)[threshold_idxs]

    # computer false positive
    fps = threshold_idxs + 1 - tps
    # ------------------------------ computer tpr and fpr---------------------------
    # Add an extra threshold position
    # to make sure that the curve starts at (0, 0)
    tps = np.r_[0, tps]
    fps = np.r_[0, fps]
    if fps[-1] <= 0:
        fpr = np.repeat(np.nan, fps.shape)
    else:
        fpr = fps / fps[-1]
    if tps[-1] <= 0:
        tpr = np.repeat(np.nan, tps.shape)
    else:
        tpr = tps / tps[-1]
    # -------------------------------computer auc------------------------------------
    height = np.diff(fpr)
    bottom = np.convolve(tpr, v=[1, 1], mode='valid')
    auc = np.sum(height * bottom / 2)

    return tpr, fpr, auc


def roc_plot(tpr, fpr, auc):
    """

    :param tpr:
    :param fpr:
    :param auc:
    :return:
    """
    plt.figure(figsize=(12, 8))

    plt.plot(fpr, tpr, color='darkorange',
             lw=2, label='ROC curve (area = {:.4f})'.format(auc))
    plt.plot([0, 1], [0, 1], color='navy', lw=2, linestyle='--')
    plt.fill_between(fpr, tpr, color='C0', alpha=0.4, interpolate=True)
    plt.xlim([0.0, 1.0])
    plt.ylim([0.0, 1.05])
    plt.xlabel('False Positive Rate')
    plt.ylabel('True Positive Rate')
    plt.title('Receiver operating characteristic example')
    plt.legend(loc="upper left")
    plt.show()


def main():
    y_label = [1, 1, 1, 1, 1, 0, 1, 0, 1, 0, 0, 1, 0, 0, 1, 0, 0, 0, 1, 0]

    y_score = [-0.20079125, 0.30423529, 0.2010557, 0.27523383, 0.42592946, -0.15043958,
               -0.08794977, -0.12733765, 0.22931154, -0.23913774, -0.0638661, -0.14958713,
               -0.04915145, 0.09898199, 0.05155884, -0.1142967, 0.16105883, 0.04871601,
               -0.08258422, -0.26105925]

    tpr, fpr, auc = get_roc(y_label, y_score)
    roc_plot(tpr, fpr, auc=auc)
    print('Done')


if __name__ == "__main__":
    main()
实现5 sql:
整体计算:
select
    (ry - 0.5*n1*(n1+1))/n0/n1 as auc
from(
    select
        sum(if(y=0, 1, 0)) as n0, --50
        sum(if(y=1, 1, 0)) as n1,--100
        sum(if(y=1, r, 0)) as ry --100
    from(
        select y, row_number() over(order by score asc) as r
        from(
            select label as y, score
            from table.name
        )A
    )B
)C
分场景计算:
select
    scene,(ry - 0.5*n1*(n1+1))/n0/n1 as auc
from(
    select scene,
        sum(if(y=0, 1, 0)) as n0, --50
        sum(if(y=1, 1, 0)) as n1,--100
        sum(if(y=1, r, 0)) as ry --100
    from(
        select scene,y, row_number() over(partition by scene order by score asc) as r
        from(
            select scene,label as y, score
            from table.name
        )A
    )B group by scene
)C
用SQL计算AUC的三种方法
方法2:按照图像面积累加(最后转化后跟公式版一样)
横面积:以负样本为阈值,每次为一格,每次就是1 / N
纵面积:第一次大于负样本(第一个)为 a1/M 个,第二次大于负样本(第二个)为 a2/M 个。
总面积:1 / N * a1/M + 1 / N * a2/M + … = (a1+a2+… )/ M*N ; 分子为正大于负的总个数。
参考:LTR那点事—AUC及其与线上点击率的关联详解
总结:其实就是按照第二种画法去求的,将样本拍好序列,然后对于每个负样本为阈值,每过一次负样本就往横坐标去移动,然后横坐标的分割为1/N,纵坐标的高度即为每个负样本socre高的正样本的个数,即为正样本概率大于负样本概率的个数。
5:auc优点 / 缺点
优点:
a:AUC衡量的是一种排序能力,因此特别适合排序类业务;
b:AUC对正负样本均衡并不敏感,在样本不均衡的情况下,也可以做出合理的评估。其他指标比如precision,recall,F1,根据区分正负样本阈值的变化会有不同的结果,而AUC不需要手动设定阈值,是一种整体上的衡量方法。
缺点:
a:忽略了预测的概率值和模型的拟合程度;
b:AUC反应了太过笼统的信息。无法反应召回率、精确率等在实际业务中经常关心的指标;它没有给出模型误差的空间分布信息,AUC只关注正负样本之间的排序,并不关心正样本内部,或者负样本内部的排序,这样我们也无法衡量样本对于好坏客户的好坏程度的刻画能力;
6:采样对AUC的影响?
问题:负采样在什么情况下提高auc ? 有些时候负采样提高不了auc。
7:auc衍生指标
衍生1:总体计算没有反映个人(gauc)
auc缺点:
1:不同用户,对比的个数不一样。造成影响不一样。
2:无法体现不同用户真实的排序能力。
如何计算GAUC:一般场景下权重为用户曝光的长度。
trick:
1:实际处理时可以尝试过滤掉单个用户全是正样本或负样本的情况。
2:尽量不做batch的gauc指标,无法捕捉到用户的所有样本。
gauc其他场景的用处:
1:实数型目标时,转化为2分类,比如预测时长转为“有效播放”,“是否长播放”。
2:在计算ctr的gauc时候,将权重调整为用户观看时长;计算cvr时候,转为用户消费金额。将重点反应模型对高价值用户群体的排序性能。
gauc代码实现:
#!/usr/bin/env python
#-*- coding: utf-8 -*-

import numpy as np
from sklearn.metrics import roc_auc_score
from collections import defaultdict

def gauc(label, pred, user_id):
    '''
    :param label: ground truth
    :param prob: predicted prob
    :param user_id: user index
    :return: gauc
    '''
    if(len(label) != len(user_id)):
        raise ValueError("impression id num should equal to the sample num,"\
                         "impression id num is {}".format(len(user_id)))
    group_truth = defaultdict(lambda: [])
    group_score = defaultdict(lambda: [])
    for idx, truth in enumerate(label):
        uid = user_id[idx]
        group_truth[uid].append(label[idx])
        group_score[uid].append(pred[idx])
    group_flag = defaultdict(lambda: False)
    for uid in set(user_id):
        truths = group_truth[uid]
        for i in range(len(truths)-1):
            if(truths[i] != truths[i+1]):
                flag = True
                break
        group_flag[uid] = flag
    total_auc = 0
    total_impression = 0
    for uid in group_flag:
        if group_flag[uid]:
            total_auc += len(group_truth[uid]) * roc_auc_score(np.asarray(group_truth[uid]), np.asarray(group_score[uid]))
            total_impression += len(group_truth[uid])
    group_auc = float(total_auc) / total_impression
    group_auc = round(group_auc, 4)
    return group_auc

if __name__ == '__main__':
    user_id = ['a', 'a', 'a', 'b', 'b', 'b', 'a']
    label = [1, 0, 1, 0, 1, 1, 0]
    pred = [0.4, 0.5, 0.7, 0.2, 0.6, 0.7, 0.4]
    group_auc = gauc(label, pred, user_id)
    print('group_auc: {:.4f}'.format(group_auc))
    auc = roc_auc_score(label, pred)
    print("auc: {:.4f}".format(auc))
参考:推荐算法评价指标
8:你auc为啥这么高?过拟合了吧!论不平衡数据的评价指标选择
现象:比如阈值0.5,label=1样本在0.7正太分布,如果100个正样本,那么在0.5以上有80个,召回率80%,准确率为XX,如果1000个正样本,那么在0.5以上有800个,召回率80%不变,但是准确率就会变大,因为正样本在所有样本中的比例变大。
总结:不平衡比例在1:1到1:10的时候,如果你对正负样本的识别都比较看重,可以用用Accurate;在1:10到1:100之间的时候,可以用用AUC;极端不平衡时,分段统计P和R更加务实。
https://zhuanlan.zhihu.com/p/552278753
衍生2:在广告场景中有缺陷(CPM-sensitive AUC)
但是在广告排序场景下,线上排序通常考虑收益最大化,通过CTR * Bid进行排序,而非仅仅通过CTR进行排序。如果线下仅仅通过AUC来评价离线模型的效果,你往往会发现,线下的AUC涨了,但是线上的收入eCPM(千次广告展示收入)却降了。这是因为线下AUC的评估仅考虑点击率CTR,而线上展示不仅考虑了CTR,同时考虑了广告主的出价BID,二者之间存在一定的gap。
csAUC中,样本的排序是多层次的,负例是的level是最低的(lowest),而正例会按照其对应的bid进行排序,正例的bid越高,其level也是越高的。
参考:RS Meet DL(75)-考虑CPM的评估方法csAUC
问题:auc / PR 区别
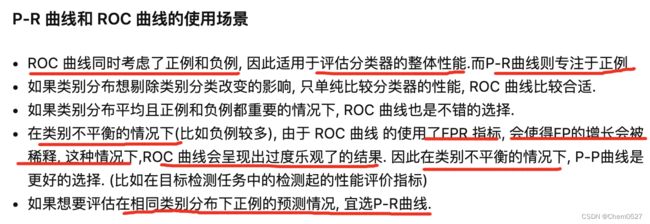
P-R曲线及与ROC曲线区别
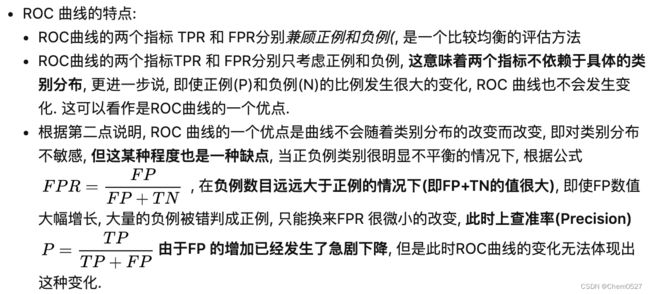
PR曲线会随着正负样本比例的变化而变化;但是ROC曲线不会。
从公式(2)和表中可以看出,TPR考虑的是第一行,实际都是正例,FPR考虑的是第二行,实际都是负例。因此,在正负样本数量不均衡的时候,比如负样本的数量增加到原来的10倍,那TPR不受影响,FPR的各项也是成比例的增加,并不会有太大的变化。因此,在样本不均衡的情况下,同样ROC曲线仍然能较好地评价分类器的性能,这是ROC的一个优良特性,也是为什么一般ROC曲线使用更多的原因。
即假设采样是随机的,采样完成后,给定一条正样本,模型预测为score1,由于采样随机,则大于score1的负样本和小于score1的负样本的比例不会发生变化。
但如果采样不是均匀的,比如采用word2vec的negative sample,其负样本更偏向于从热门样本中采样,则会发现auc值发生剧烈变化。
