Vue3+Three.js+antvG2实战项目 智慧城市(五)
前言
在网上找了很久都没有找到使用Three.js开发智慧城市的免费文章或者免费视频,自己花了一点时间做了一个纯前端的智慧城市项目。
技术栈都是最新的:vue3+vite+typeScript+Three+antv G2
源码分享 源码
模型,天空图盒子链接分享(不想下载源码可以只用下这个)提取码1234
20230424_152716
智慧城市项目的录制视频
–
智慧城市的大屏部分讲完了 接下来的 图表和头部都用定位定过去
App.vue
<template>
  <div class="container" id="container">
    <header class="header">智慧上海驾驶舱</header>
    <section class="leftTop"></section>
    <section class="leftCenter"></section>
    <section class="leftFooter"></section>
    <section class="rightTop"></section>
    <section class="rightCenter"></section>
    <section class="rightFooter"></section>
 </div>
</template>
<style>
.container{
  width:100vw;
  height: 100vh;
  overflow: hidden;
}
.header{
  width: 100vw;
  height: 80px;
  position: fixed;
  top: 0;
  text-align: center;
  font-size: 28px;
  letter-spacing: 4px;
  line-height: 65px;
  color:#fff;
  background-image: url("../public/img/23.png");
  background-size: 100% 100%;
  background-repeat: no-repeat;
}
.leftTop{
  width: 400px;
  height: 310px;
  position: fixed;
  z-index: 9999999;
  top: 40px;
  left:20px;
  border-radius: 10px;
  background-color: rgba(6,7,80,0.6);
}
.leftCenter{
  width: 400px;
  height: 310px;
  position: fixed;
  z-index: 9999999;
  top: 370px;
  left:20px;
  border-radius: 10px;
  background-color: rgba(6,7,80,0.6);
}
.leftFooter{
  width: 400px;
  height: 210px;
  position: fixed;
  z-index: 9999999;
  top: 700px;
  left:20px;
  border-radius: 10px;
  background-color: rgba(6,7,80,0.6);
}
.rightTop{
  width: 400px;
  height: 310px;
  position: fixed;
  z-index: 9999999;
  top: 40px;
  right:20px;
  border-radius: 10px;
  background-color: rgba(6,7,80,0.6);
}
.rightCenter{
  width: 400px;
  height: 310px;
  position: fixed;
  z-index: 9999999;
  top: 370px;
  right:20px;
  border-radius: 10px;
  background-color: rgba(6,7,80,0.6);
}
.rightFooter{
  width: 400px;
  height: 210px;
  position: fixed;
  z-index: 9999999;
  top: 700px;
  right:20px;
  border-radius: 10px;
  background-color: rgba(6,7,80,0.6);
}
</style>
效果如下
大致结构我们搭建好了 接下来的步骤
1.我们做几个antv的组件 柱状图 条形图 折线图的组件
2.然后引入到我们刚刚创建好的app.vue 的 div 里面去
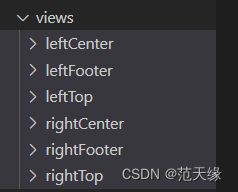
1.在views文件夹里面创建如下图的文件夹

leftCenter文件夹->index.vue的代码
<!--  -->
<template>
  <div class="leftTopModule">
    <header class="head">
        <titleModule :title="state.titleName"></titleModule>
    </header>
    <section class="main" id="main"></section>
  </div>
</template>

<script setup>
import { onMounted, reactive } from 'vue'
import titleModule from '../../components/title/index.vue'
import { Bar } from '@antv/g2plot';
const state = reactive({
    titleName:'各区GDP'
})
//创建饼图
const createBar = () =>{
    //1.创建数据源
    const data = [
        { year: '浦东新区', sales: 15353 },
        { year: '徐汇区', sales: 2176 },
        { year: '长宁区', sales: 1561 },
        { year: '黄埔区', sales: 2616 },
        { year: '普陀区', sales: 1226 },
    ]
    //2.创建bar对象
    const barPlot = new Bar('main',{
        data,
        xField:'sales',
        yField:'year',
        colorField:'year',
        color:(d)=>{
            console.log(d)
            if(d.year == '浦东新区') return '#5AD8A6';
            if(d.year == '徐汇区') return '#F6BD16';
            if(d.year == '长宁区') return '#E86452';
            if(d.year == '黄埔区') return '#6DC8EC';
            if(d.year == '普陀区') return '#945FB9';
        },
        xAxis:{
            label:{
                visible:false,
                style:{
                    fontSize:17,
                }
            },
            tickLine:{
                visible:false
            }
        },
        yAxis:{
            label:{
                style:{
                    fontSize:17,
                }
            },
            grid:{
                visible:false
            }
        },
    })
    //3.渲染
    barPlot.render();
}

onMounted(()=>{
    createBar()
})
</script>
<style  scoped>
.leftTopModule{
    width: 100%;
    height: 100%;
}
.head{
    width: 100%;
    height: 15%;
    display: flex;
    align-items: center;
    justify-content: center;
}
.main{
    width: 95%;
    height: 82%;
    margin: 0 auto;
}
</style>
因为六个文件夹的代码太多了 这里我只做一个示例 其他五个文件夹的代码 可以复制leftCenter的
2.然后在app.vue引入组件
<div class="container" id="container">
    <header class="header">智慧上海驾驶舱</header>
    <section class="leftTop">
      <LeftTop />
    </section>
    <section class="leftCenter"></section>
    <section class="leftFooter"></section>
    <section class="rightTop"></section>
    <section class="rightCenter"></section>
    <section class="rightFooter"></section>
</div>
<script lang="ts" setup>
import LeftTop from './views/leftTop/index.vue'
</script>
智慧城市我们就讲完了